Month: October 2016

Investment For Sustainable Growth

When the 2008 financial crisis hit, outlays on both consumption and housing plummeted, yet the investment that should have picked up the slack never materialized. It is time to usher in an era of high investment in sustainable development.

The big disappointment in the world economy today is the low rate of investment. In the years leading up to the 2008 financial crisis, growth in high-income countries was propelled by spending on housing and private consumption. When the crisis hit, both kinds of spending plummeted, and the investments that should have picked up the slack never materialized. This must change.

After the crisis, the world’s major central banks attempted to revive spending and employment by slashing interest rates. The strategy worked, to some extent. By flooding capital markets with liquidity and holding down market interest rates, policymakers encouraged investors to bid up stock and bond prices. This created financial wealth through capital gains, while spurring consumption and – through initial public offerings – some investment.

Yet this policy has reached its limits – and imposed undeniable costs. With interest rates at or even below zero, investors borrow for highly speculative purposes. As a result, the overall quality of investments has dropped, while leverage has risen. When central banks finally tighten credit, there is a real risk of significant asset-price declines.

As monetary policy was being pushed to its limits, what went missing was an increase in long-term investments in high-speed rail, roads, ports, low-carbon energy, safe water and sanitation, and health and education. With budget austerity restraining public investment, and major uncertainties concerning public policy and international taxation hampering private investment, such spending has generally declined in the high-income countries.

Despite US President Barack Obama’s promises of investment in high-speed rail and other modern infrastructure, not one mile of fast rail was built during his eight years in office. It is time to translate words into action, in the United States and elsewhere, and usher in a new era of high investment in sustainable development.

There are three challenges facing such a strategy: identifying the right projects; developing complex plans that involve both the public and private sectors (and often more than one country); and structuring the financing. To succeed, governments must be capable of effective long-term planning, budgeting, and project implementation. China has demonstrated these capabilities in the last 20 years (though with major environmental failures), whereas the US and Europe have been stymied. The poorest countries, meanwhile, have often been told by the International Monetary Fund and others not even to try.

Today, governments will have some help in overcoming at least one of the key challenges. The Sustainable Development Goals (SDGs) and the Paris Climate Agreement will help to guide them toward the right projects.

The world needs , and an end to the construction of new coal-fired power plants. And it needs massive investments in electric vehicles (and advanced batteries), together with a sharp reduction in internal combustion engine vehicles. The developing world, in particular, also needs major investments in water and sanitation projects in fast-growing urban areas. And low-income countries, in particular, need to scale up health and education systems.

China’s “one belt, one road” initiative – which aims to link Asia to Europe with modern infrastructure networks – will help to advance some of these goals, assuming the projects are designed with a low-carbon-energy future in mind. That initiative will boost employment, spending, and growth, especially in the landlocked economies across Eurasia. It should even deliver new dynamism to economic and diplomatic relations among the European Union, Russia, and China.

A similar program is needed urgently in Africa. Although African countries have already identified priority investments for electrification and transport, progress will remain slow without a new wave of investment spending.

African countries’ combined spending on education alone should increase by tens of billions of dollars per year; combined infrastructure spending should surge by at least $100 billion per year. These needs should be covered mostly by long-term, low-interest-rate loans from China, Europe, and the US, as well as by mobilizing African countries’ long-term savings (through, for example, the introduction of new pension systems).

The US and Europe also need . The US – where the last big infrastructure project, the national highway system, was concluded in the 1970s – should emphasize investment in low-carbon energy, high-speed rail, and the mass uptake of electric vehicles.

As for Europe, the European Commission’s Investment Plan for Europe – dubbed the “Juncker Plan,” for Commission President Jean-Claude Juncker – should become the EU’s SDG program. It should focus, for example, on creating a Europe-wide transmission grid for low-carbon energy, and on a massive increase in .

To help finance such programs, the multilateral development banks – such as the World Bank, the Asian Development Bank, and the African Development Bank – should raise vastly more long-term debt from the capital markets at the prevailing low interest rates. They should then lend those funds to governments and public-private investment entities.

Governments should levy gradually rising carbon taxes, using the revenues to finance low-carbon energy systems. And the egregious loopholes in the global corporate-tax system should be closed, thereby boosting global corporate taxation by some $200 billion annually, if not more. (American companies are currently sitting on nearly $2 trillion in offshore funds that should finally be taxed.) The added revenues should be allocated to new public investment spending.

For the poorest countries, much of the needed investment should come through increased official development assistance. There are several ways to generate that extra aid money via a reduction of military spending, including by ending the wars in the Middle East; deciding firmly against a next generation of nuclear weapons; cutting back on US military bases overseas; and avoiding a US-China arms race through enhanced diplomacy and cooperation. The resulting peace dividend should be channeled toward health care, education, and infrastructure in today’s impoverished and war-torn regions.

Sustainable development is not just a wish and a slogan; it offers the only realistic path to global growth and high employment. It is time to give it the attention – and investment – it deserves.
The Fatal Expense Of American Imperialism

The single most important issue in allocating national resources is war versus peace, or as macroeconomists put it, “guns versus butter.” The United States is getting this choice profoundly wrong, squandering vast sums and undermining national security. In economic and geopolitical terms, America suffers from what Yale historian Paul Kennedy calls “imperial overreach.” If our next president remains trapped in expensive Middle East wars, the budgetary costs alone could derail any hopes for solving our vast domestic problems.

It may seem tendentious to call America an empire, but the term fits certain realities of US power and how it’s used. An empire is a group of territories under a single power. Nineteenth-century Britain was obviously an empire when it ruled India, Egypt, and dozens of other colonies in Africa, Asia, and the Caribbean. The United States directly rules only a handful of conquered islands (Hawaii, Puerto Rico, Guam, Samoa, the Northern Mariana Islands), but it stations troops and has used force to influence who governs in dozens of other sovereign countries. That grip on power beyond America’s own shores is now weakening.

The scale of US military operations is remarkable. The US Department of Defense has (as of a 2010 inventory) 4,999 military facilities, of which 4,249 are in the United States; 88 are in overseas US territories; and 662 are in 36 foreign countries and foreign territories, in all regions of the world. Not counted in this list are the secret facilities of the US intelligence agencies. The cost of running these military operations and the wars they support is extraordinary, around $900 billion per year, or 5 percent of US national income, when one adds the budgets of the Pentagon, the intelligence agencies, homeland security, nuclear weapons programs in the Department of Energy, and veterans benefits. The $900 billion in annual spending is roughly one-quarter of all federal government outlays.

The United States has a long history of using covert and overt means to overthrow governments deemed to be unfriendly to US interests, following the classic imperial strategy of rule through locally imposed friendly regimes. In a powerful study of Latin America between 1898 and 1994, for example, historian John Coatsworth counts 41 cases of “successful” US-led regime change, for an average rate of one government overthrow by the United States every 28 months for a century. And note: Coatsworth’s count does not include the failed attempts, such as the Bay of Pigs invasion of Cuba.

This tradition of US-led regime change has been part and parcel of US foreign policy in other parts of the world, including Europe, Africa, the Middle East, and Southeast Asia. Wars of regime change are costly to the United States, and often devastating to the countries involved. Two major studies have measured the costs of the Iraq and Afghanistan wars. One, by my Columbia colleague Joseph Stiglitz and Harvard scholar Linda Bilmes, arrived at the cost of $3 trillion as of 2008. A more recent study, by the Cost of War Project at Brown University, puts the price tag at $4.7 trillion through 2016. Over a 15-year period, the $4.7 trillion amounts to roughly $300 billion per year, and is more than the combined total outlays from 2001 to 2016 for the federal departments of education, energy, labor, interior, and transportation, and the National Science Foundation, National Institutes of Health, and the Environmental Protection Agency.

It is nearly a truism that US wars of regime change have rarely served America’s security needs. Even when the wars succeed in overthrowing a government, as in the case of the Taliban in Afghanistan, Saddam Hussein in Iraq, and Moammar Khadafy in Libya, the result is rarely a stable government, and is more often a civil war. A “successful” regime change often lights a long fuse leading to a future explosion, such as the 1953 overthrow of Iran’s democratically elected government and installation of the autocratic Shah of Iran, which was followed by the Iranian Revolution of 1979. In many other cases, such as the US attempts (with Saudi Arabia and Turkey) to overthrow Syria’s Bashar al-Assad, the result is a bloodbath and military standoff rather than an overthrow of the government.

What is the deep motivation for these profligate wars and for the far-flung military bases that support them?

From 1950 to 1990, the superficial answer would have been the Cold War. Yet America’s imperial behavior overseas predates the Cold War by half a century (back to the Spanish-American War, in 1898) and has outlasted it by another quarter century. America’s overseas imperial adventures began after the Civil War and the final conquests of the Native American nations. At that point, US political and business leaders sought to join the European empires — especially Britain, France, Russia, and the newly emergent Germany — in overseas conquests. In short order, America grabbed the Philippines, Puerto Rico, Cuba, Panama, and Hawaii, and joined the European imperial powers in knocking on the doors of China.

As of the 1890s, the United States was by far the world’s largest economy, but until World War II, it took a back seat to the British Empire in global naval power, imperial reach, and geopolitical dominance. The British were the unrivaled masters of regime change — for example, in carving up the corpse of the Ottoman Empire after World War I. Yet the exhaustion from two world wars and the Great Depression ended the British and French empires after World War II and thrust the United States and Russia into the forefront as the two main global empires. The Cold War had begun.

The economic underpinning of America’s global reach was unprecedented. As of 1950, US output constituted a remarkable 27 percent of global output, with the Soviet Union roughly a third of that, around 10 percent. The Cold War fed two fundamental ideas that would shape American foreign policy till now. The first was that the United States was in a struggle for survival against the Soviet empire. The second was that every country, no matter how remote, was a battlefield in that global war. While the United States and the Soviet Union would avoid a direct confrontation, they flexed their muscles in hot wars around the world that served as proxies for the superpower competition.

Over the course of nearly a half century, Cuba, Congo, Ghana, Indonesia, Vietnam, Laos, Cambodia, El Salvador, Nicaragua, Iran, Namibia, Mozambique, Chile, Afghanistan, Lebanon, and even tiny Granada, among many others, were interpreted by US strategists as battlegrounds with the Soviet empire. Often, far more prosaic interests were involved. Private companies like United Fruit International and ITT convinced friends in high places (most famously the Dulles brothers, Secretary of State John Foster and CIA director Allen) that land reforms or threatened expropriations of corporate assets were dire threats to US interests, and therefore in need of US-led regime change. Oil interests in the Middle East were another repeated cause of war, as had been the case for the British Empire from the 1920s.

These wars destabilized and impoverished the countries involved rather than settling the politics in America’s favor. The wars of regime change were, with few exceptions, a litany of foreign policy failure. They were also extraordinarily costly for the United States itself. The Vietnam War was of course the greatest of the debacles, so expensive, so bloody, and so controversial that it crowded out Lyndon Johnson’s other, far more important and promising war, the War on Poverty, in the United States.

The end of the Cold War, in 1991, should have been the occasion for a fundamental reorientation of US guns-versus-butter policies. The occasion offered the United States and the world a “peace dividend,” the opportunity to reorient the world and US economy from war footing to sustainable development. Indeed, the Rio Earth Summit, in 1992, established sustainable development as the centerpiece of global cooperation, or so it seemed.

Alas, the blinders and arrogance of American imperial thinking prevented the United States from settling down to a new era of peace. As the Cold War was ending, the United States was beginning a new era of wars, this time in the Middle East. The United States would sweep away the Soviet-backed regimes in the Middle East and establish unrivalled US political dominance. Or at least that was the plan.

The quarter century since 1991 has therefore been marked by a perpetual US war in the Middle East, one that has destabilized the region, massively diverted resources away from civilian needs toward the military, and helped to create mass budget deficits and the buildup of public debt. The imperial thinking has led to wars of regime change in Afghanistan, Iraq, Libya, Yemen, Somalia, and Syria, across four presidencies: George H.W. Bush, Bill Clinton, George W. Bush, and Barack Obama. The same thinking has induced the United States to expand NATO to Russia’s borders, despite the fact that NATO’s supposed purpose was to defend against an adversary — the Soviet Union — that no longer exists. Former Soviet president Mikhail Gorbachev has emphasized that eastward NATO expansion “was certainly a violation of the spirit of those declarations and assurances that we were given in 1990,” regarding the future of East-West security.

There is a major economic difference, however, between now and 1991, much less 1950. At the start of the Cold War, in 1950, the United States produced around 27 percent of world output. As of 1991, when the Dick Cheney and Paul Wolfowitz dreams of US dominance were taking shape, the United States accounted for around 22 percent of world production. By now, according to IMF estimates, the US share is 16 percent, while China has surpassed the United States, at around 18 percent. By 2021, according to projections by the International Monetary Fund, the United States will produce roughly 15 percent of global output compared with China’s 20 percent. The United States is incurring massive public debt and cutting back on urgent public investments at home in order to sustain a dysfunctional, militarized, and costly foreign policy.

Thus comes a fundamental choice. The United States can vainly continue the neoconservative project of unipolar dominance, even as the recent failures in the Middle East and America’s declining economic preeminence guarantee the ultimate failure of this imperial vision. If, as some neoconservatives support, the United States now engages in an arms race with China, we are bound to come up short in a decade or two, if not sooner. The costly wars in the Middle East — even if continued much less enlarged in a Hillary Clinton presidency — could easily end any realistic hopes for a new era of scaled-up federal investments in education, workforce training, infrastructure, science and technology, and the environment.

The far smarter approach will be to maintain America’s defensive capabilities but end its imperial pretensions. This, in practice, means cutting back on the far-flung network of military bases, ending wars of regime change, avoiding a new arms race (especially in next-generation nuclear weapons), and engaging China, India, Russia, and other regional powers in stepped-up diplomacy through the United Nations, especially through shared actions on the UN’s Sustainable Development Goals, including climate change, disease control, and global education.

Many American conservatives will sneer at the very thought that the United States’ room for maneuver should be limited in the slightest by the UN. But think how much better off the United States would be today had it heeded the UN Security Council’s wise opposition to the wars of regime change in Iraq, Libya, and Syria. Many conservatives will point to Vladimir Putin’s actions in Crimea as proof that diplomacy with Russia is useless, without recognizing that it was NATO’s expansion to the Baltics and its 2008 invitation to Ukraine to join NATO, that was a primary trigger of Putin’s response.

In the end, the Soviet Union bankrupted itself through costly foreign adventures such as the 1979 invasion of Afghanistan and its vast over-investment in the military. Today the United States has similarly over-invested in the military, and could follow a similar path to decline if it continues the wars in the Middle East and invites an arms race with China. It’s time to abandon the reveries, burdens, and self-deceptions of empire and to invest in sustainable development at home and in partnership with the rest of the world.

Facing Up To Income Inequality

The Census Bureau recently announced a heartening 5 percent gain in the median household income between 2014 and 2015, the largest one-year gain on record. Yet a look at the longer-term trends offers a sobering perspective. The jump in household income merely helps to make up for lost ground; the median earnings in 2015 were actually lower than back in 1999 — 16 years ago.

While household median incomes have stagnated since the late 1990s, the inflation-adjusted earnings of poorer households have stagnated for even longer, roughly 40 years. Meanwhile, households at or near the top of the income distribution have enjoyed sizeable increases of living standards. The result is a stark widening of the gap between rich and poor households.

There is perhaps no issue in America more contentious than income inequality. Everybody has a theory as to why the gap between rich and poor has widened and what should be done — if anything — to close it. A full explanation should help us understand why the United States stands out for having an especially high and rising inequality of income.

There are three main factors at play: technology, trade, and politics. Technological innovations have raised the demand for highly trained workers, thereby pushing up the incomes of college-educated workers relative to high-school-educated workers. Global trade has exposed the wages of industrial workers to tough international competition from workers at much lower pay scales. And our federal politics has tended, during the past 35 years, to weaken the political role of the working class, diminish union bargaining power, and cap or cut the government benefits received by working-class families.

Consider technology. Throughout modern history, ingenious machines have been invented to replace heavy physical labor. This has been hugely beneficial: Most (though not all) American workers have been lucky to escape the hard toil, drudgery, dangers, and diseases of heavy farm work, mining, and heavy industry. Farm jobs have been lost, but with some exceptions, their backbreaking drudgery has been transformed into office jobs. Farm workers and miners combined now account for less than 1 percent of the labor force.

Yet the office jobs required more skills than the farm jobs that disappeared. The new office jobs needed a high school education, and, more recently, a college degree. So who benefited? Middle-class and upper-class kids fortunate enough to receive the education and skills for the new office jobs. And who lost? Mostly poorer kids who couldn’t afford the education to meet the rising demands for skilled work.

Now the race between education and technology has again heated up. The machines are getting smarter and better faster than ever before — indeed, faster than countless households can help their kids to stay in the job market. Sure, there are still good jobs available, as long as you’ve graduated with a degree in computer science from MIT, or at least a nod in that direction.

Globalization is closely related to technology and, indeed, is made possible by it. It has a similar effect, of squeezing incomes of lower-skilled workers. Not only are the assembly-line robots competing for American jobs; so too are the lower-waged workers half a world away from the United States. American workers in so-called “traded-goods” sectors, meaning the sectors in direct competition with imports, have therefore faced an additional whammy of intense downward pressure on wages.

For a long time, economists resisted the public’s concern about trade depressing wages of lower-skilled workers. Twenty-two years ago I coauthored a paper arguing that rising trade with China and other low-wage countries was squeezing the earnings of America’s lower-skilled workers. The paper was met with skepticism. A generation later, the economics profession has mostly come around to recognize that globalization is a culprit in the rise of income inequality. This doesn’t mean that global trade should be ended, since trade does indeed expand the overall economy. It does, however, suggest that open trade should be accompanied by policies to improve the lot of lower-wage, lower-skilled workers, especially those directly hit by global trade but also those indirectly affected.

Many analyses of rising income inequality stop at this point, emphasizing the twin roles of technology and trade, and perhaps debating their relative importance. Yet the third part of the story — the role of politics — is perhaps the most vital of all. Politics shows up in two ways. First, politics helps to determine the bargaining power of workers versus corporations: how the overall pie is divided between capital and labor. Second, politics determines whether the federal budget is used to spread the benefits of a rising economy to the workers and households left behind.

Unfortunately, US politics has tended to put the government’s muscle on behalf of big business and against the working class. Remember the Reagan revolution: tax cuts for the rich and the companies, and union-busting for the workers? Remember the Clinton program to “end welfare as we know it,” a program that pushed poor and working-class moms into long-distance commuting for desperately low wages, while their kids were often left back in dangerous and squalid conditions? Remember the case of the federal minimum wage, which has been kept so low for so long by Congress that its inflation-adjusted value peaked in 1968?

There is no deep mystery as to why federal politics has turned its back on the poor and working class. The political system has become “pay to play,” with federal election cycles now costing up to $10 billion, largely financed by the well-heeled class in the Hamptons and the C-suites of Wall Street and Big Oil, certainly not the little guy on unemployment benefits. As the insightful political scientist Martin Gilens has persuasively shown, when it comes to federal public policy, only the views of the rich actually have sway in Washington.

So in the end, the inequality of income in the United States is high and rising while in other countries facing the same technological and trade forces, the inequality remains lower, and the rise in inequality has tended to be less stark. What explains the difference in outcomes? In the other countries, democratic politics offers voice and representation to average voters rather than to the rich. Votes and voters matter more than dollars.

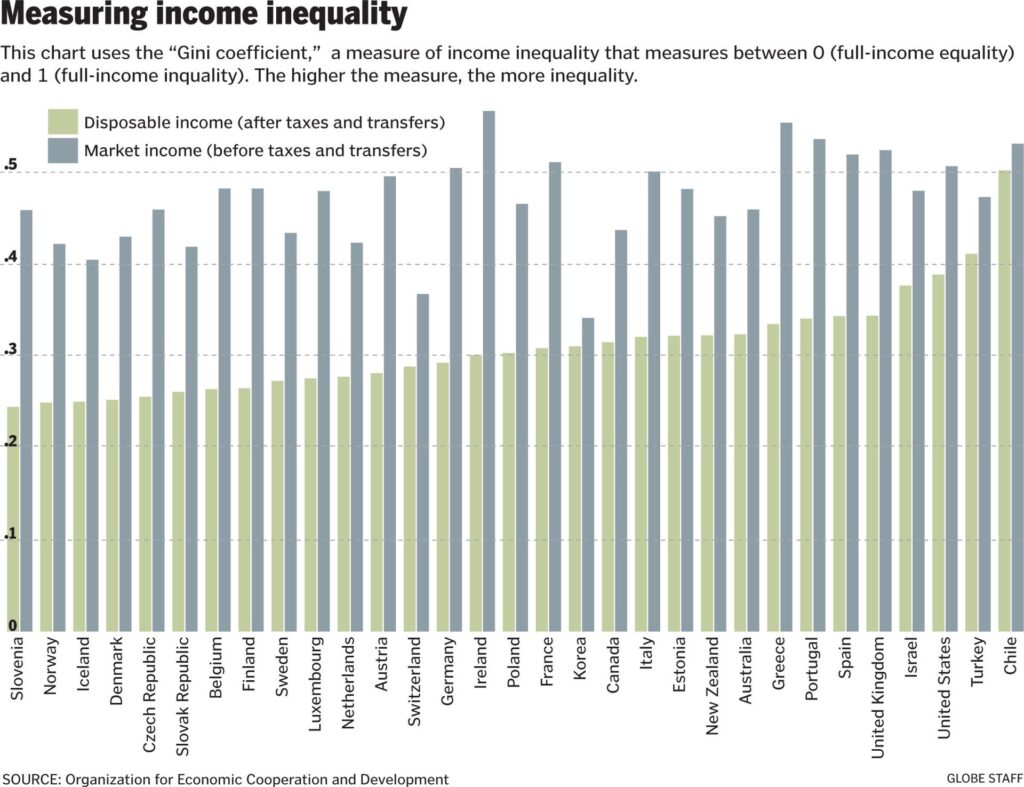
To delve more deeply into the comparison between the United States and other countries, it is useful to measure the inequality of income in each country in two different ways. The first way measures the inequality of “market incomes” of households, that is, the income of households measured before taxes and government benefits are taken into account. The second measures the inequality of “disposable income,” taking into account the taxes paid and transfers received by the household.

The difference between the two measures shows the extent of income redistribution achieved through government taxation and spending. In all of the high-income countries, the inequality of market income is greater than the inequality of disposable income. The taxes paid by the relatively rich and the transfers made to the relatively poor help to offset some of the inequality of the marketplace.

The accompanying chart offers just this comparison for the high-income countries. For each country, two measures of inequality based on the “Gini coefficient” are calculated. The Gini coefficient is a measure of income inequality that varies between 0 (full-income equality across households) and 1 (full-income inequality, in which one household has all of the income). Countries as a whole tend to have a Gini coefficient of disposable income somewhere between 0.25 (low inequality) and 0.60 (very high inequality).

In the figure, we see the two values of the Gini coefficient for each country: a higher value (more inequality) based on market income and a lower value (less inequality) based on disposable income (that is, after taxes and transfers). We can see that in every country, the tax-and-transfer system shifts at least some income from the rich to the poor, thereby pushing down the Gini coefficient. Yet the amount of net redistribution is very different in different countries, and is especially low in the United States.

Compare, for example, the United States and Denmark. In the United States, the Gini coefficient on market income is a very high 0.51, and on disposable income, 0.40, still quite high. In Denmark, by comparison, the Gini coefficient on market income is a bit lower than the United States, at 0.43. Yet Denmark’s Gini coefficient on disposable income is far lower, only 0.25. America’s tax-and-transfer system reduces the Gini coefficient by only 0.11. Denmark’s tax-and-transfer system reduces the Gini coefficient by 0.18, half-again as high as in the United States.

How does Denmark end up with so much lower inequality of disposable income from its budget policies? Denmark taxes more heavily than the United States and uses the greater tax revenue to provide free health care, child care, sick leave, maternity and paternity leave, guaranteed vacations, free university tuition, early childhood programs, and much more. Denmark taxes a hefty 51 percent of national income and provides a robust range of high-quality public services. The United States taxes a far lower 31 percent and offers a rickety social safety net. In the United States, people are left to sink or swim. Many sink.

So, many Americans would suspect, Denmark is miserable and being crushed by taxes, right? Well, not so right. Denmark actually comes out number 1 in the world happiness rankings, while the United States comes in 13th. Denmark’s life expectancy is also higher, its poverty lower, and its citizens’ trust in government and in each other vastly higher than the equivalent trust in the United States.

So herin lies a key lesson for the United States. America’s inequality of disposable income is the highest among the rich countries. America is paying a heavy price in lost well-being for its high and rising inequality of income, and for its failure to shift more benefits to the poor and working class.

We have become a country of huge distrust of government and of each other; we have become a country with a huge underclass of people who can’t afford their prescription drugs, tuition payments, or rents or mortgage payments. Despite a roughly threefold increase in national income per person over the past 50 years, Americans report to survey takers no higher level of happiness than they did back in 1960. The fraying of America’s social ties, the increased loneliness and distrust, eats away at the American dream and the American spirit. It’s even contributing to a rise in the death rates among middle-aged, white, non-Hispanic Americans, a shocking recent reversal of very long-term trends of rising longevity.

The current trends will tend to get even worse unless and until American politics changes direction. As I will describe in a later column, the coming generation of yet smarter machines and robots will claim additional jobs among the lower-skilled workers and those performing rote activities. Wages will be pushed lower except for those with higher training and skills. Capital owners (who will own the robots and the software systems to operate them) will reap large profits while many young people will be unable to find gainful employment. The advance in technology could thereby contribute to a further downward spiral in social cohesion.

That is, unless we decide to do things differently. Twenty-eight countries in the Organization for Economic Cooperation and Development have lower inequality of disposable income than the United States, even though these countries share the same technologies and compete in the same global marketplace as the United States. These income comparisons underscore that America’s high inequality is a choice, not an irreversible law of the modern world economy.


The State Of Women’s Representation On The Eve Of The 2016 Election

Hailed by some as a second “Year of the Woman,” the 2014 election was a positive — but by no means watershed — election for the advancement of women’s representation. For the first time, over 100 of the 535 members of the U.S. Congress were women. Additionally, New Hampshire became the first and only state to reach gender parity in elected office according to Representation 2020’s Gender Parity Index. Yet, only five female governors were elected in the 36 gubernatorial races held in 2014 and Americans elected fewer female state legislators than in 2012.

Let’s reflect on where women’s representation is at in the lead up to the 2016 elections.

Measuring women’s representation: Representation 2020’s Gender Parity Index

In order to quantify progress toward gender parity in elected office, Representation 2020 developed the Gender Parity Index. Each year, a Gender Parity Score is calculated for the U.S. and each of the 50 states. The Gender Parity Score measures women’s recent electoral success at the local, state and national level on a scale of 0 (if no women were elected to any offices) to 100 (if women held all such offices). A state with gender parity in elected office would receive a Gender Parity Score of 50 out of 100.The key advantage of the Gender Parity Score is that it enables comparisons over time and between states.

Only five states were more than three-fifths the way to parity in the lead up to the 2016 election

Overall, progress toward parity was made in 2016. The median Gender Parity Score in the 50 states increased from 18.1 at the end of 2014 to 18.7 in October 2016. However, only five states received a Gender Parity Score of more than 30 points: Arizona, California, Minnesota, New Hampshire and Washington. An additional seven states are one fifth or less of the way to gender parity in elected office: Georgia, Louisiana, Mississippi, Pennsylvania, South Dakota, Utah and Virginia.

The Gender Parity Index shows that we are less than halfway to gender parity

Both the first “Year of the Woman” election in 1992 and the 2014 election advanced women’s representation. It is important, however, to keep those advances in perspective. Current strategies to advance women’s representation have gotten us less than two-fifths of the way there — 96 years after the ratification of the 19th Amendment guaranteeing suffrage to women. We can’t wait another 96 years (or longer) to reach gender parity in elective office. Representation 2020 understands that it is important to train and fund more women candidates. In addition, however, we need structural reforms — of candidate recruitment practices, electoral systems, and legislative rules — that level the playing field to hasten our progress toward gender parity in elected office.

New Hampshire leads the nation

New Hampshire ranks highest in our 2016 Parity Index with a score of 55, slightly above gender parity in elected office. The state scored 9.9 points higher than the second-placed state (Washington). In 2012, New Hampshire was the first state in the nation to elect an all-female delegation to Congress — and currently 3 of its four-member congressional delegation are women. The current governor is female (Maggie Hassan, who is running for U.S. Senate in 2016), 29% of its state legislators are women, and the mayor of the state’s fifth largest city, Dover, is a woman. New Hampshire was also the first state in the nation to have a majority-female state legislative chamber (state senate from 2009 to 2010).

Mississippi ranks last

Mississippi received the lowest Gender Parity Score in the nation with just 6.4 points. As we head into the 2016 election, Mississippi is the only state that has never elected a woman to the governor’s mansion or to the U.S. Congress. The 2016 election will not change that: there are no female major party candidates running for the U.S. House, and no races for U.S. Senate or governor. Only four women have ever served in statewide elective office in Mississippi, 2 of whom are in office today. None of Mississippi’s 9 cities with populations greater than 30,000 people currently have female mayors.

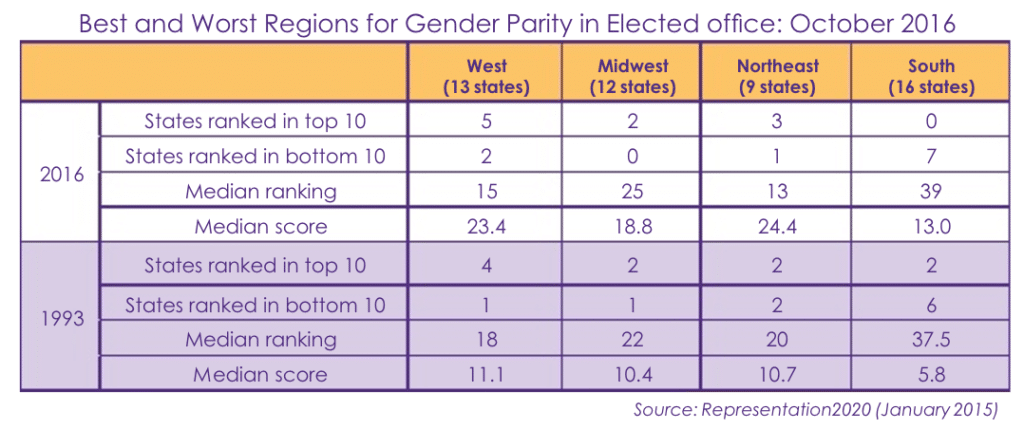
Regional Trends: The Northeast and West excel, while the South lags behind

The West and the Northeast outperform the Midwest and the South in gender parity in elected office. Eight of the 10 states with the highest Gender Parity Scores in July 2016 were in the Northeast or West (Arizona, California, Hawaii Maine, Massachusetts, New Hampshire, New Mexico and Washington). By contrast, seven of the 10 states with the lowest Gender Parity Score are in the South (Alabama, Georgia, Kentucky, Louisiana, Mississippi, Texas and Virginia).

The disparity between the South and other regions has widened in the past few decades. In 1993, two southern states (Maryland and Texas) ranked in the top 10 states for gender parity, while six (Alabama, Louisiana, Oklahoma, South Carolina, Tennessee, and Virginia) ranked in the bottom 10.


No state legislative chambers are at parity

In the lead up to the 2016 election, not a single state has gender parity in its state legislature. The legislative chamber closest to parity in the nation is the Colorado House of Representatives, with 46.2% female legislators. In November 2014, 50 female candidates ran for the 65 seats in the Colorado House of Representatives, according to the Center for American Women and Politics, and 30 were elected. Not surprisingly, Colorado ranked first for the proportion of women in its state legislature, with 42.0% female state legislators in July 2016. Ranked lowest was Wyoming at 13.3%. In 1993, the range was from 39.5% (Washington) to 5.1% (Kentucky)— showing advances for the lowest-ranking states, but less improvement for states at the top.


Fewer women in state legislatures

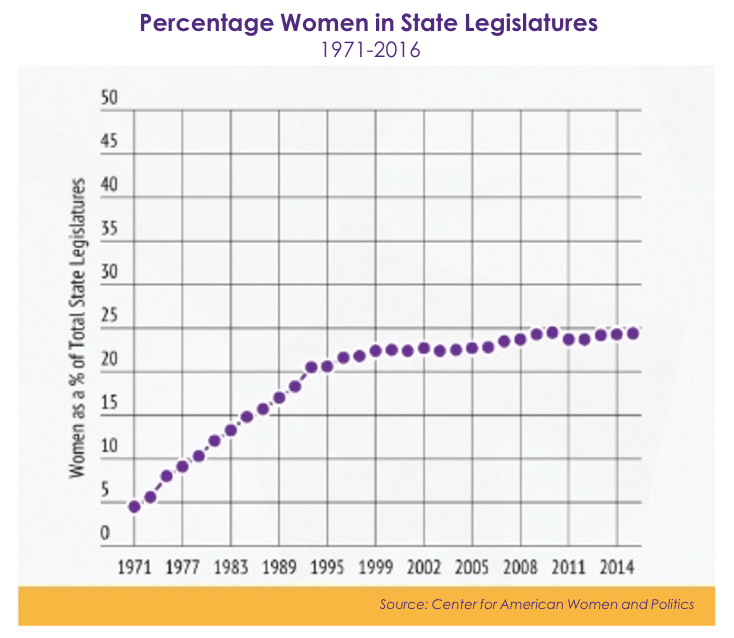
The proportion of women state legislators actually declined slightly as a result of the 2014 election. Currently, 1,791 (24.3%) state legislators are women. If we take a broader view, we can see that the progress toward gender parity in state legislatures is slowing down from the 1970s, which is worrying. Without new initiatives, progress may stall completely.