Month: January 2017

Debunking The Voter Fraud Myth

The president has continued to claim voter fraud was a problem in the 2016 election. A look at the facts makes clear fraud is rare, and does not happen on a scale even close to necessary to “rig” an election.

[Download PDF]

Sensationalist claims have circulated this election season about the extent of voter fraud, with some politicians going so far as to tell voters to fear that this November’s election will be “rigged.” Because electoral integrity is one of the elements necessary to making America the greatest democracy in the world, claims like this garner media attention, and frighten and concern voters. But putting rhetoric aside to look at the facts makes clear that fraud by voters at the polls is vanishingly rare, and does not happen on a scale even close to that necessary to “rig” an election.

Studies Agree: Impersonation Fraud by Voters Very Rarely Happens

The Brennan Center’s seminal report on this issue, The Truth About Voter Fraud, found that most reported incidents of voter fraud are actually traceable to other sources, such as clerical errors or bad data matching practices. The report reviewed elections that had been meticulously studied for voter fraud, and found incident rates between 0.0003 percent and 0.0025 percent. Given this tiny incident rate for voter impersonation fraud, it is more likely, the report noted, that an American “will be struck by lightning than that he will impersonate another voter at the polls.”

A study published by a Columbia University political scientist tracked incidence rates for voter fraud for two years, and found that the rare fraud that was reported generally could be traced to “false claims by the loser of a close race, mischief and administrative or voter error.”

2017 analysis published in The Washington Post concluded that there is no evidence to support Trump’s claim that Massachusetts residents were bused into New Hampshire to vote.

comprehensive 2014 study published in The Washington Post found 31 credible instances of impersonation fraud from 2000 to 2014, out of more than 1 billion ballots cast. Even this tiny number is likely inflated, as the study’s author counted not just prosecutions or convictions, but any and all credible claims.

Two studies done at Arizona State University, one in 2012 and another in 2016, found similarly negligible rates of impersonation fraud. The project found 10 cases of voter impersonation fraud nationwide from 2000-2012. The follow-up study, which looked for fraud specifically in states where politicians have argued that fraud is a pernicious problem, found zero successful prosecutions for impersonation fraud in five states from 2012-2016.

  • A review of the 2016 election found four documented cases of voter fraud.
  • Research into the 2016 election found no evidence of widespread voter fraud.
  • 2016 working paper concluded that the upper limit on double voting in the 2012 election was 0.02%. The paper noted that the incident rate was likely much lower, given audits conducted by the researchers showed that “many, if not all, of these apparent double votes could be a result of measurement error.”
  • 2014 paper concluded that “the likely percent of non-citizen voters in recent US elections is 0.”
  • 2014 nationwide study found “no evidence of widespread impersonation fraud” in the 2012 election.
  • 2014 study that examined impersonation fraud both at the polls and by mail ballot found zero instances in the jurisdictions studied.
  • 2014 study by the non-partisan Government Accountability Office, which reflected a literature review of the existing research on voter fraud, noted that the studies consistently found “few instances of in-person voter fraud.”
  • While writing a 2012 book, a researcher went back 30 years to try to find an example of voter impersonation fraud determining the outcome of an election, but was unable to find even one.
  • 2012 study exhaustively pulled records from every state for all alleged election fraud, and found the overall fraud rate to be “infinitesimal” and impersonation fraud by voters at the polls to be the rarest fraud of all: only 10 cases alleged in 12 years. The same study found only 56 alleged cases of non-citizen voting, in 12 years.
  • 2012 assessment of Georgia’s 2006 election found “no evidence that election fraud was committed under the auspices of deceased registrants.”
  • 2011 study by the Republican National Lawyers Association found that, between 2000 and 2010, 21 states had 1 or 0 convictions for voter fraud or other kinds of voting irregularities.
  • 2010 book cataloguing reported incidents of voter fraud concluded that nearly all allegations turned out to be clerical errors or mistakes, not fraud.
  • 2009 analysis examined 12 states and found that fraud by voters was “very rare,” and also concluded that many of the cases that garnered media attention were ultimately unsubstantiated upon further review.
  • Additional research on noncitizen voting can be found here: http://www.brennancenter.org/analysis/analysis-noncitizen-voting-vanishingly-rare.
  • Additional resources can be found here: https://www.brennancenter.org/analysis/analysis-and-reports.

Courts Agree: Fraud by Voters at the Polls is Nearly Non-Existent

  • The Fifth Circuit, in an opinion finding that Texas’s strict photo ID law is racially discriminatory, noted that there were “only two convictions for in-person voter impersonation fraud out of 20 million votes cast in the decade” before Texas passed its law.
  • In its opinion striking down North Carolina’s omnibus restrictive election law —which included a voter ID requirement — as purposefully racially discriminatory, the Fourth Circuit noted that the state “failed to identify even a single individual who has ever been charged with committing in-person voter fraud in North Carolina.”
  • federal trial court in Wisconsin reviewing that state’s strict photo ID law found “that impersonation fraud — the type of fraud that voter ID is designed to prevent — is extremely rare” and “a truly isolated phenomenon that has not posed a significant threat to the integrity of Wisconsin’s elections.”
  • Even the Supreme Court, in its opinion in Crawford upholding Indiana’s voter ID law, noted that the record in the case “contains no evidence of any [in-person voter impersonation] fraud actually occurring in Indiana at any time in its history.” Two of the jurists who weighed in on that case at the time — Republican-appointed former Supreme Court Justice John Paul Stevens and conservative appellate court Judge Richard Posner — have since announced they regret their votes in favor of the law, with Judge Posner noting that strict photo ID laws are “now widely regarded as a means of voter suppression rather than of fraud prevention.”

Government Investigations Agree: Voter Fraud Is Rare

  • Kansas Secretary of State Kris Kobach, a longtime proponent of voter suppression efforts, argued before state lawmakers that his office needed special power to prosecute voter fraud, because he knew of 100 such cases in his state. After being granted these powers, he has brought six such cases, of which only four have been successful. The secretary has also testified about his review of 84 million votes cast in 22 states, which yielded 14 instances of fraud referred for prosecution, which amounts to a 0.00000017 percent fraud rate.
  • Texas lawmakers purported to pass its strict photo ID law to protect against voter fraud. Yet the chief law enforcement official in the state responsible for such prosecutions knew of only one conviction and one guilty plea that involved in-person voter fraud in all Texas elections from 2002 through 2014.
  • A specialized United States Department of Justice unit formed with the goal of finding instances of federal election fraud examined the 2002 and 2004 federal elections, and were able to prove that 0.00000013 percent of ballots cast were fraudulent. There was no evidence that any of these incidents involved in-person impersonation fraud. Over a five year period, they found “no concerted effort to tilt the election.”
  • An investigation in Colorado, in which the Secretary of State alleged 100 cases of voter fraud, yielded one conviction.
  • In Maine, an investigation into 200 college students revealed no evidence of fraud. Shortly thereafter, an Elections Commission appointed by a Republican secretary of state found “there is little or no history in Maine of voter impersonation or identification fraud.”
  • In Florida, a criminal investigation into nine individuals who allegedly committed absentee ballot fraud led to all criminal charges being dismissed against all voters.
  • In 2012, Florida Governor Rick Scott initiated an effort to remove non-citizen registrants from the state’s rolls. The state’s list of 182,000 alleged non-citizen registrants quickly dwindled to 198. Even this amended list contained many false positives, such as a WWII veteran born in Brooklyn. In the end, only 85 non-citizen registrants were identified and only one was convicted of fraud, out of a total of 12 million registered voters.
  • In Iowa, a multi-year investigation into fraud led to just 27 prosecutions out of 1.6 million ballots cast. In 2014 the state issued a report on the investigation citing only six prosecutions.
  • In Wisconsin, a task force charged 20 individuals with election crimes. The majority charged were individuals with prior criminal convictions, who are often caught up by confusing laws regarding restoration of their voting rights.

The verdict is in from every corner that voter fraud is sufficiently rare that it simply could not and does not happen at the rate even approaching that which would be required to “rig” an election. Electoral integrity is key to our democracy, and politicians who genuinely care about protecting our elections should focus not on phantom fraud concerns, but on those abuses that actually threaten election security.

As historians and election experts have catalogued, there is a long history in this country of racially suppressive voting measures — including poll taxes and all-white primaries — put in place under the guise of stopping voter fraud that wasn’t actually occurring in the first place. The surest way toward voting that is truly free, fair, and accessible is to know the facts in the face of such rhetoric.
Union Membership Data And Polling

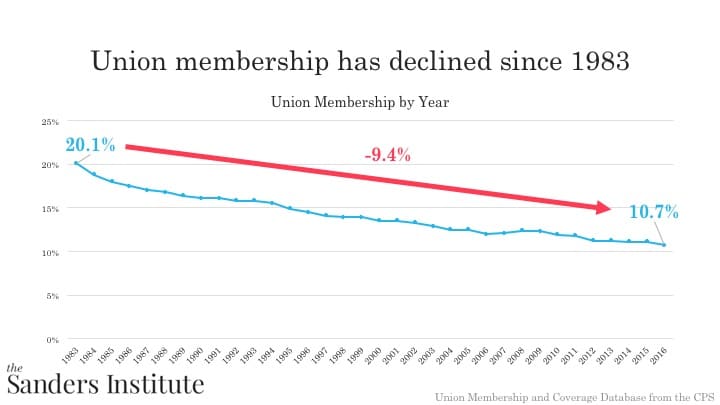
Union membership (looking at both public and private sector membership) has declined since1983, the first year for which comparable union data are available. In 2016, 10.7% of both private and public sector workers were members of unions. This percentage has declined since 1983 when union members made up 20.1% of the workforce.


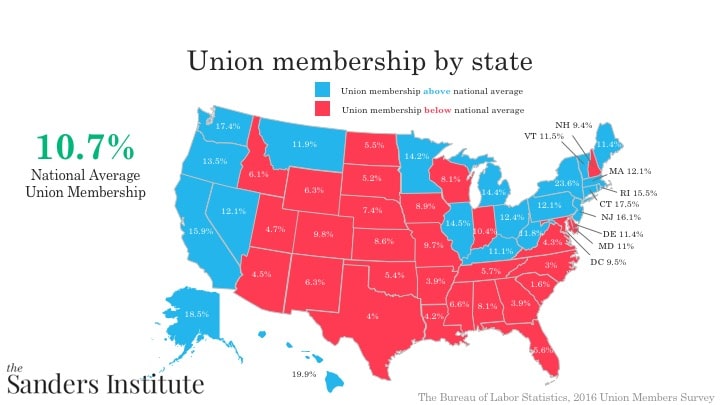
States with higher union membership than the national average tend to be states in the Northeast and West while states with lower union membership than the national average tend to be in the Midwest and South. The states with the highest union membership are New York (23.6%) and Hawaii (19.9%) while the states with the lowest union membership are South Carolina (1.6%) and North Carolina (3%).


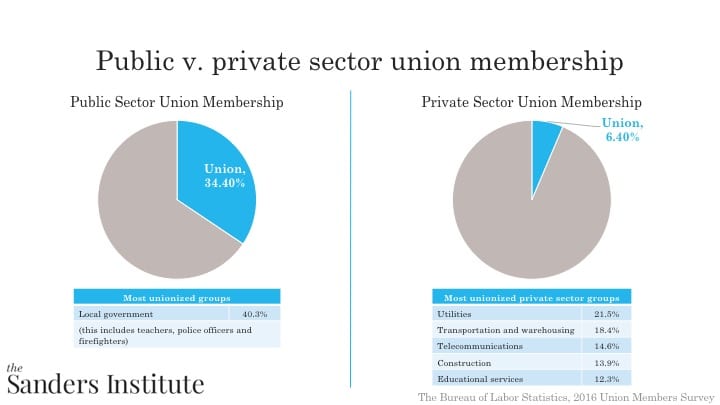
Union membership varies greatly between the public and private sectors. Union membership in the private sector is 6.4% while union membership is 5 times that in the public sector (34.4%). The most unionized professions in the private sector are utilities (21.5%) and transportation and warehousing (18.4%). The most unionized professions in the public sector is the local government where over four in ten workers are part of a union.


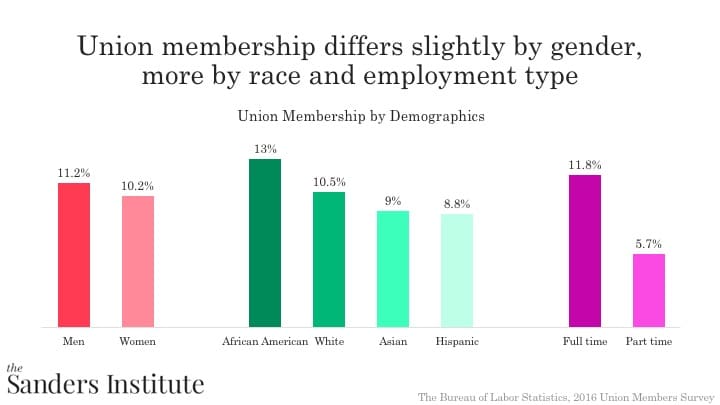
Union membership differs by certain demographics. Men (11.2%) are slightly more likely to be a union member than women (10.2%). African Americans (13%) are the most unionized race/ethnicity, followed by white (10.5%), Asian (9%), and Hispanic (8.8%) workers. Finally, full time workers (11.8%) are more likely to be unionized than part time workers (5.7%).


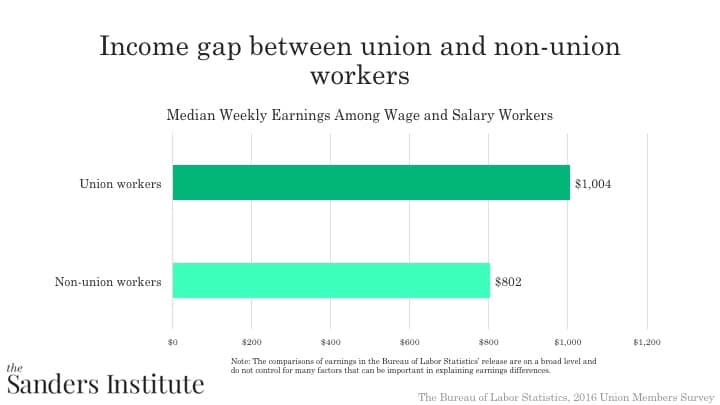
Union workers’ median weekly earnings of $1,004 a week are 20% higher than the median weekly earnings of non-union workers ($802).


PUBLIC OPINIONS OF UNIONS

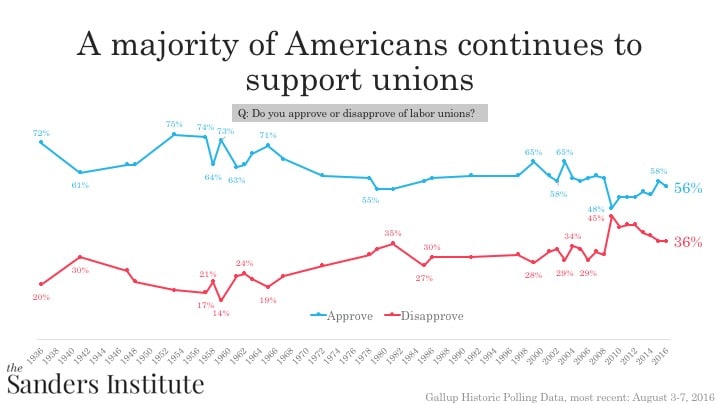
A majority of Americans (56%) approve of unions. However, this is lower than it has been in the past. Union approval was highest in the 50s with 75% approval in 1953 and 74% in 1957. After the 50s, union approval decreased. It reached its lowest point in 2009 when a plurality (48%) of Americans approved of unions, only slightly more than the 43% who disapproved of unions. Since that low point, union approval has increased to its current level at 56%.


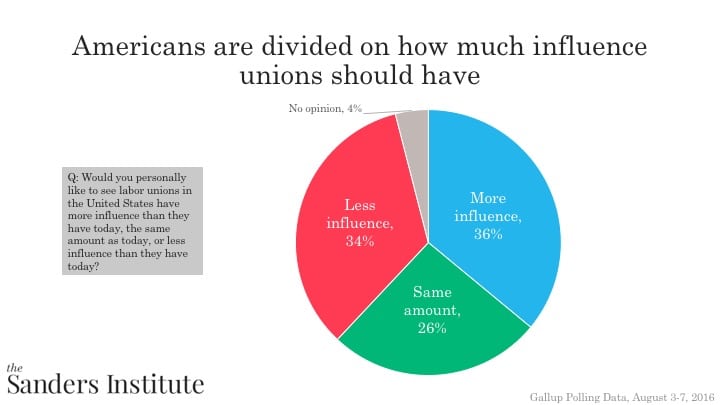
Despite a majority of Americans approving of unions, Americans are divided on how much influence unions should have. A slight plurality think that unions should have more influence (36%) while only slightly fewer think that unions should have less influence (34%), and only slightly more than a quarter of Americans (26%) think that unions should have the same amount of influence.


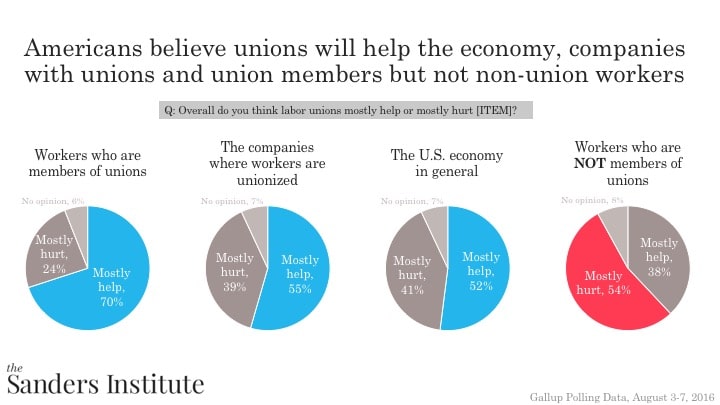
A large majority of Americans (70%) believe that unions mostly help the workers who are members of unions. Majorities of Americans also believe that unions help the companies where workers are unionized (55%) and the U.S. economy (52%). However, a majority (54%) of Americans believes that unions mostly hurt workers who are not members of unions.


US Foreign Policy – From Primacy To Global Problem Solving

Not for decades has American foreign policy been as uncertain and contested as it is today. At the start of the Trump administration, the challenges of foreign policy are of fundamental significance for US national security, and for global peace and prosperity.

Today I’m inaugurating a new weekly series on America and the world that will look deeply at the US foreign policy debate, taking into account the rapid changes underway in the world economy, advanced technologies, and population trends. Our well-being and national security will depend on Americans understanding how the world has changed and how we must change our attitudes and approaches to it.

The world seems to be a sea of problems: the Syrian war; the related European refugee crisis; ISIS and terrorist attacks across the globe; Russia’s brazen hacking of the US election; China’s rising territorial claims in the South China Sea; North Korea’s growing nuclear threat; and much more.

Yet the world also offers a host of new opportunities. China, India, and the African Union are each home to more than a billion people with rapid economic growth and a rising middle class. The information revolution continues to advance at a dazzling rate. Robotics, artificial intelligence, and ubiquitous broadband offer the chances for dramatic breakthroughs in health care, education, and renewable energy, at home and globally.

If US foreign policy is only about the threats and not the opportunities, the United States will miss out on the rapid advances in well-being that the new technological revolution can deliver, and that would help to stabilize today’s conflict zones. The fundamental challenge facing US foreign policy is to keep America safe without busting the military budget, dragging America into needless wars, or diverting our attention and resources from the opportunity to build a smart, fair, and sustainable US and world economy.

There are three distinct sets of voices in the current foreign policy debate.

The first group, whom I call the primacists, argues that the United States should continue to aim for global “primacy,” or geopolitical dominance, maintained by unrivaled US military superiority. This group sees US military dominance as both feasible and necessary for global stability.

The second group, whom I call the realists, argues that the United States must accept a (realistic) balance of power rather than US primacy. Yet like the primacists, the realists argue for “peace through strength.” They believe a new arms race is the necessary price to pay in order to keep the global balance of power and preserve US security.

The third group, whom I call the cooperatists, argues that cooperation between nations is not only feasible but necessary to avoid war and to sustain prosperity. In their view, cooperation would spare the world a costly and dangerous new arms race between the United States and the emerging powers, one that could spill over into open conflict. Second, cooperation would enable the United States and indeed the world to seize the opportunities opened by the current technological revolution to boost economic growth and overcome global ills that include global warming, emerging diseases, and mass migration.

The coming foreign policy battles in the Trump years will pit these three visions against each other, most likely in a fierce pitched battle for the hearts and minds of the American people. I am firmly in the cooperatist camp. I believe that primacy is a dangerous illusion for America in the 21st century, while realism is excessively pessimistic about the potential for diplomacy. In this series, I will seek to explain the options facing the United States.

Consider the current US policy debate regarding China.

The primacists see China’s rise as an unacceptable threat to US primacy. They argue that the United States should invest trillions of dollars in a new arms buildup that China could not afford. They call for trade and technology measures to limit China’s future economic growth. The primacists recall that when Ronald Reagan led a military buildup in the 1980s, the Soviet Union went bankrupt trying to keep up. They think the same would happen to China today. They argue that the benefits to the United States of a unilateral US arms buildup would far exceed the costs, with benefits in the form of enhanced US prestige, global leadership, national security, and the safety of overseas investments.

Suppose, as an illustration, that the primacists call for $5 trillion investment in new armaments, believing that the arms buildup will enable the United States to gain $10 trillion in geopolitical advantages from China, for a net US benefit of $5 trillion and a net loss to China of $10 trillion.

The realists agree with the primacists that a unilateral US military buildup would give the United States a net gain, but they believe that China would match US arms buildup. Even so, the realists say that the United States should make the investment. Their reasoning: If China invests $5 trillion in armaments while the United States does not, then China will take $10 trillion in geopolitical advantage. Yet if the United States also invests $5 trillion in new armaments, it avoids the $10 trillion geopolitical loss. And if, inexplicably, China decides not to arm, then the United States would garner a net gain of $5 trillion in geopolitical benefits.

Using game theory jargon, the realists argue that an arms buildup is America’s (and China’s) “dominant” strategy. If China arms, then the United States must do so as well. If China chooses not to arm, then the United States can secure a huge geopolitical advantage through its own military buildup. No matter what China does, therefore, the United States should arm. Since China reasons symmetrically, both countries end up arming, and each incurs a $5 trillion cost but ends up at a standstill. According to the realists, the $5 trillion is the unavoidable cost to pay to ensure America’s geopolitical standing.

Hold on, say the cooperatists. Surely our two countries can come to their senses. The arms race would cause a net loss of $5 trillion to each country, money that both countries urgently need for education, health care, renewable energy, and cutting-edge infrastructure. Rather than an arms race, let’s agree with China that neither side will arm. Better still, let’s agree to pool some of our resources into new high-tech ventures together to advance cutting-edge global solutions for low-carbon energy, quality education, health care for all, and other vital mutual and global goals.

The essence of careful foreign policy analysis is to size up these contrasting positions.

The realists, for their part, feel that an arms race with China and with Russia is more or less inevitable. They point to the bad behavior of China and Russia as proof that diplomacy is useless. China is busy expanding its military presence in the South China Sea. Russia is hacking US politics, bombing Aleppo, and destabilizing Ukraine. How could the United States possibly trust those countries?

As a cooperatist, I say, “Not so fast.” China’s and Russia’s actions might look aggressive from our point of view, but they are viewed as defensive steps from their vantage point. Many Chinese strategists plausibly believe that America will try to stifle China’s future economic growth and note that the United States outspends China on the military by more than 2-to-1 ($596 billion to $215 billion, in 2015). They hardly feel like the aggressors.

Russian strategists similarly argue that it was the United States, not Russia, that provoked the recent deterioration of relations in recent years. They point to US meddling in Russia’s internal politics going back many years, and perhaps even more provocatively, to America’s meddling in Ukraine as well. Russian strategists particularly object to the US attempts to bring Ukraine into NATO, which of course would bring the US-led military alliance right up to Russia’s border, and to NATO’s deployment of missile defense systems in Eastern Europe that Russia asserts could be used for offensive purposes. (The new missile deployments follow America’s unilateral withdrawal in 2002 from the US-Soviet ABM treaty.)

Once upon a time, the primacist view might have been at least plausible as an achievable aim. Consider 1945, when the United States constituted about 30 percent of the world economy and dominated every industrial sector and advanced technology. US global leadership at the time seemed necessary to American and European strategists to stop Soviet subversion of postwar Western Europe and parts of Asia following the Soviet Union’s brutal occupation and subjugation of Eastern Europe at the end of World War II. Even then, many supporters of US “containment” of Soviet expansion warned the United States against a grandiosity and overreach in America’s foreign policy objectives.

Times are very different now. Not only is the Soviet Union long gone, but the US share of world output has also declined sharply, to roughly 16 percent today. The US economy is actually smaller than China’s when both economies are measured by a common set of international prices. The US goal of global primacy seems both unnecessary and unachievable in these very different conditions.

Another fundamental change is the much greater need for global cooperation regarding global warming, emerging diseases, and mass migration. If the United States and China view each other as military competitors, they are far less likely to view each other as partners in environmental sustainability. Our mindset — conflict or cooperation — will shape not only our arms spending, but our chances to control global warming, fight newly emerging diseases, and invest together in cutting-edge technologies.

A third fundamental change is that the world now has the institutional machinery to sustain global cooperation, thanks to the United Nations and its various component institutions. Importantly, the 193 member states of the UN have agreed, as of 2015, on a new cooperative framework for sustainable development and for fighting climate change. It took hard work over many years to secure a unanimous global agreement on the Sustainable Development Goals and the Paris Climate Agreement. It would be especially foolhardy and indeed reckless to turn America’s back on those hard-won unanimous achievements.

In each region of the world, the United States will face the choice between conflict and cooperation. How will the Trump administration come down on that choice? Does Trump’s tough talk about China, nuclear arms, trade wars, and the infamous Mexican wall portend an assertion of American primacy, or was it merely bluster for the campaign trail?

Trump has assembled an administration filled with China-bashers, protectionists, and military hardliners. Yet he has also assembled business people, like himself, who like to make a buck (in fact, billions of them) and who have actively and profitably invested for years in Russia, China, and other emerging economies. Indeed, Trump is being harshly criticized from the Republican right for chumming up to Vladimir Putin, especially in the context of Russia’s e-mail hacking. Yet on this issue, it is Trump not his critics who seems intent on renewed cooperation rather than conflict. Of course, one theory holds that Trump aims to improve relations with Russia mainly to put even more geopolitical pressure on China, which Trump may deem to be America’s real competitor. (If the evidence eventually shows that Trump’s associates colluded with Russia in the hacking, the result would almost surely be a deep US political crisis and the collapse of any hopes for cooperation with Russia in the short term.)

Most importantly, foreign policy cannot be a spectator sport, where Americans learn about their place in the world through the next midnight tweet. Americans will need to learn by studying the options, and then to speak out, loudly and clearly, for the option of constructive cooperation over the dangerous claims of primacy and war-mongering.

Fired Up At Civil Rights Rally In Washington DC

On Saturday January 14th, 2017, former Ohio State Senator Nina Turner delivered a speech in front of the Martin Luther King Jr. memorial in Washington D.C. at National Action Network’s We Will Not Be Moved rally. 


Stephanie Kelton And Amar Reganti – Can We Afford It? Economic Priorities For The Next Administration

“That’s a good idea … but how will you pay for it?” This is the question posed to every candidate who has ever had an idea for any program ever. Following one of the most polarizing and contentious electoral cycles in modern memory, it’s time to discuss what that question really means. Together, two former D.C. insiders will interrogate the public understanding of the federal budgeting process.


Social Security Frequently Asked Questions

Q1: When did Social Security start?

A: The Social Security Act was signed by FDR on 8/14/35. Taxes were collected for the first time in January 1937 and the first one-time, lump-sum payments were made that same month. Regular ongoing monthly benefits started in January 1940.

Q2: What is the origin of the term “Social Security?”

A: The term was first used in the U.S. by Abraham Epstein in connection with his group, the American Association for Social Security. Originally, the Social Security Act of 1935 was named the Economic Security Act, but this title was changed during Congressional consideration of the bill. (The full story has been recounted by Professor Edwin Witte who was present at the event.)

Q3: When did Medicare start?

A: Medicare was passed into law on July 30, 1965 but beneficiaries were first able to sign-up for the program on July 1, 1966.

Q4: Is it true that Social Security was originally just a retirement program?

A: Yes. Under the 1935 law, what we now think of as Social Security only paid retirement benefits to the primary worker. A 1939 change in the law added survivors benefits and benefits for the retiree’s spouse and children. In 1956 disability benefits were added.

Keep in mind, however, that the Social Security Act itself was much broader than just the program which today we commonly describe as “Social Security.” The original 1935 law contained the first national unemployment compensation program, aid to the states for various health and welfare programs, and the Aid to Dependent Children program. (Full text of the 1935 law.)

Q5: Is it true that members of Congress do not have to pay into Social Security?

A: No, it is not true. All members of Congress, the President and Vice President, Federal judges, and most political appointees, were covered under the Social Security program starting in January 1984. They pay into the system just like everyone else. Thus all members of Congress, no matter how long they have been in office, have been paying into the Social Security system since January 1984.

(Prior to this time, most Federal government workers and officials were participants in the Civil Service Retirement System (CSRS) which came into being in 1920–15 years before the Social Security system was formed. For this reason, historically, Federal employees were not participants in the Social Security system.)

Employees of the three branches of the federal government, were also covered starting in January 1984, under the 1983 law–but with some special transition rules.

  1. Executive and judicial branch employees hired before January 1, 1984 were given a one-time irrevocable choice of whether to switch to Social Security or stay under the old CSRS. (Rehired employees–other than rehired annuitants–are treated like new employees if their break-in-service was more than a year.)
  2. Employees of the legislative branch who were not participating in the CSRS system were mandatorily covered, regardless of when their service began. Those who were in the CSRS system were given the same one-time choice as employees in the executive and judicial branches.
  3. All federal employees hired on or after January 1, 1984 are mandatorily covered under Social Security–the CSRS system is not an option for them.

So there are still some Federal employees, those first hired prior to January 1984, who are not participants in the Social Security system. All other Federal government employees participate in Social Security like everyone else.

This change was part of the 1983 Amendments to Social Security. You can find a summary of the 1983 amendments elsewhere on this site.

Q6: Is is true that the age of 65 was chosen as the retirement age for Social Security because the Germans used 65 in their system, and the Germans used age 65 because their Chancellor, Otto von Bismarck, was 65 at the time they developed their system?

A: No, it is not true. Generally, age 65 was chosen to conform to contemporary practice during the 1930s.

More details:

Germany became the first nation in the world to adopt an old-age social insurance program in 1889, designed by Germany’s Chancellor, Otto von Bismarck. The idea was first put forward, at Bismarck’s behest, in 1881 by Germany’s Emperor, William the First, in a ground-breaking letter to the German Parliament. William wrote: “. . . those who are disabled from work by age and invalidity have a well-grounded claim to care from the state.”

One persistent myth about the German program is that it adopted age 65 as the standard retirement age because that was Bismarck’s age. In fact, Germany initially set age 70 as the retirement age (and Bismarck himself was 74 at the time) and it was not until 27 years later (in 1916) that the age was lowered to 65. By that time, Bismarck had been dead for 18 years.

By the time America moved to social insurance in 1935 the German system was using age 65 as its retirement age. But this was not the major influence on the Committee on Economic Security (CES) when it proposed age 65 as the retirement age under Social Security. This decision was not based on any philosophical principle or European precedent. It was, in fact, primarily pragmatic, and stemmed from two sources. One was a general observation about prevailing retirement ages in the few private pension systems in existence at the time and, more importantly, the 30 state old-age pension systems then in operation. Roughly half of the state pension systems used age 65 as the retirement age and half used age 70. The new federal Railroad Retirement System passed by Congress earlier in 1934, also used age 65 as its retirement age. Taking all this into account, the CES planners made a rough judgment that age 65 was probably more reasonable than age 70. This judgment was then confirmed by the actuarial studies. The studies showed that using age 65 produced a manageable system that could easily be made self-sustaining with only modest levels of payroll taxation. So these two factors, a kind of pragmatic judgment about prevailing retirement standards and the favorable actuarial outcome of using age 65, combined to be the real basis on which age 65 was chosen as the age for retirement under Social Security. With all due respect to Chancellor Bismarck, he had nothing to do with it.

Q7: Is it true that life expectancy was less than 65 back in 1935, so the Social Security program was designed in such a way that people would not live long enough to collect benefits?

A: Not really. Life expectancy at birth was less than 65, but this is a misleading measure. A more appropriate measure is life expectancy after attainment of adulthood, which shows that most Americans could expect to live to age 65 once they survived childhood.

More details:

If we look at life expectancy statistics from the 1930s we might come to the conclusion that the Social Security program was designed in such a way that people would work for many years paying in taxes, but would not live long enough to collect benefits. Life expectancy at birth in 1930 was indeed only 58 for men and 62 for women, and the retirement age was 65. But life expectancy at birth in the early decades of the 20th century was low due mainly to high infant mortality, and someone who died as a child would never have worked and paid into Social Security. A more appropriate measure is probably life expectancy after attainment of adulthood.

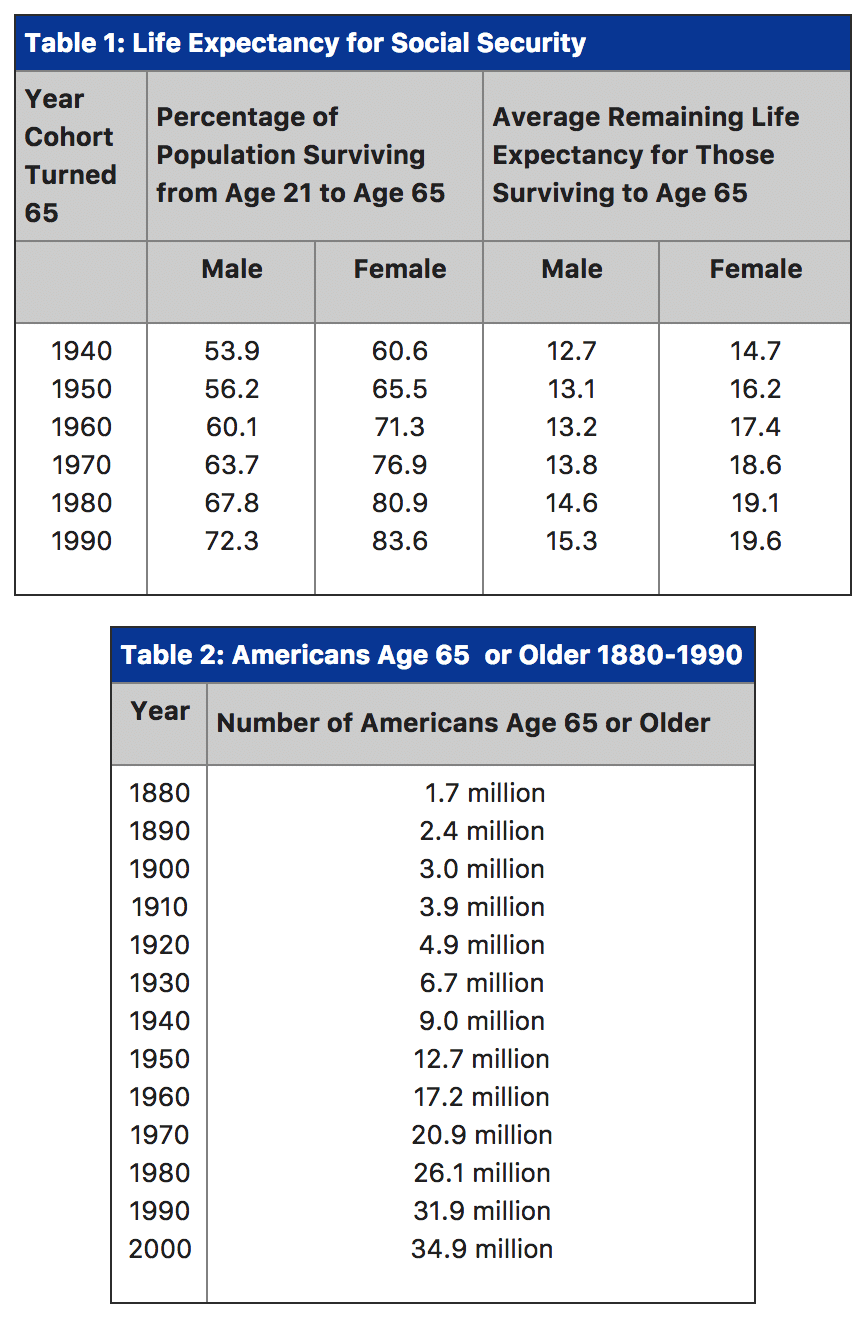
As Table 1 shows, the majority of Americans who made it to adulthood could expect to live to 65, and those who did live to 65 could look forward to collecting benefits for many years into the future. So we can observe that for men, for example, almost 54% of the them could expect to live to age 65 if they survived to age 21, and men who attained age 65 could expect to collect Social Security benefits for almost 13 years (and the numbers are even higher for women).

Also, it should be noted that there were already 7.8 million Americans age 65 or older in 1935 (cf. Table 2), so there was a large and growing population of people who could receive Social Security. Indeed, the actuarial estimates used by the Committee on Economic Security (CES) in designing the Social Security program projected that there would be 8.3 million Americans age 65 or older by 1940 (when monthly benefits started). So Social Security was not designed in such a way that few people would collect the benefits.

As Table 1 indicates, the average life expectancy at age 65 (i.e., the number of years a person could be expected to receive unreduced Social Security retirement benefits) has increased a modest 5 years (on average) since 1940. So, for example, men attaining 65 in 1990 can expect to live for 15.3 years compared to 12.7 years for men attaining 65 back in 1940.

(Increases in life expectancy are a factor in the long-range financing of Social Security; but other factors, such as the sheer size of the “baby boom” generation, and the relative proportion of workers to beneficiaries, are larger determinants of Social Security’s future financial condition.)


Q8: When did COLAs (cost-of-living allowances) start?

A: COLAs were first paid in 1975 as a result of a 1972 law. Prior to this, benefits were increased irregularly by special acts of Congress.

The Story of COLAs:

Most people are aware that there are annual increases in Social Security benefits to offset the corrosive effects of inflation on fixed incomes. These increases, now known as Cost of Living Allowances (COLAs), are such an accepted feature of the program that it is difficult to imagine a time when there were no COLAs. But in fact, when Ida May Fuller received her first $22.54 benefit payment in January of 1940, this would be the same amount she would receive each month for the next 10 years. For Ida May Fuller, and the millions of other Social Security beneficiaries like her, the amount of that first benefit check was the amount they could expect to receive for life. It was not until the 1950 Amendments that Congress first legislated an increase in benefits. Current beneficiaries had their payments recomputed and Ida May Fuller, for example, saw her monthly check increase from $22.54 to $41.30.

These recomputations were effective for September 1950 and appeared for the first time in the October 1950 checks. A second increase was legislated for September 1952. Together these two increases almost doubled the value of Social Security benefits for existing beneficiaries. From that point on, benefits were increased only when Congress enacted special legislation for that purpose.

In 1972 legislation the law was changed to provide, beginning in 1975, for automatic annual cost-of-living allowances (i.e., COLAs) based on the annual increase in consumer prices. No longer do beneficiaries have to await a special act of Congress to receive a benefit increase and no longer does inflation drain value from Social Security benefits.

Q9: What information is available from Social Security records to help in genealogical research?

A: You might want to start by checking out the Social Security Death Index which is available online from a variety of commercial services (usually the search is free). The Death Index contains a listing of persons who had a Social Security number, who are deceased, and whose death was reported to the Social Security Administration. (The information in the Death Index for people who died prior to 1962 is sketchy since SSA’s death information was not automated before that date. Death information for persons who died before 1962 is generally only in the Death Index if the death was actually reported to SSA after 1962, even though the death occurred prior to that year.)

If you find a person in the Death Index you will learn the date of birth and Social Security Number for that person. (The Social Security Death Index is not published by SSA for public use, but is made available by commercial entities using information from SSA records. We do not offer support of these commercial products nor can we answer questions about the material in the Death Index.)

Other records potentially available from SSA include the Application for a Social Security Number (form SS-5). To obtain any information from SSA you will need to file a Freedom of Information Act (FOIA) request.

Q10: Does Social Security have any lists of the most common names in use in the U.S.?

A: Yes, based on the applications for Social Security cards, SSA’s Office of the Actuary has done a series of special studies of the most common names.

Q11: Where do I get more information about the Social Security program as it exists today?

A: Go to the Social Security Online home page.

Q12: Who was the first person to get Social Security benefits?

A: A fellow named Ernest Ackerman got a payment for 17 cents in January 1937. This was a one-time, lump-sum pay-out–which was the only form of benefits paid during the start-up period January 1937 through December 1939.

Q13: If Ernest Ackerman only received a single lump-sum payment, who was the first person to received ongoing monthly benefits?

A: A woman named Ida May Fuller , from Ludlow, Vermont was the first recipient of monthly Social Security benefits.

Q14: How many people, annually, have received Social Security payments?

A: This history is available as a detailed table. (Payment history table)

There is also a (PDF-format) table which shows the minimum and maximum Retirement Benefit amounts over the years.

Q15: What is the “notch”?

A: In 1972 a technical error was introduced in the law which resulted in beneficiaries getting a double adjustment for inflation. In 1977 Congress acted to correct the error. Instead of making the correction immediate, they phased it in over a five year period (this is the notch period). This phase-in period was defined as affecting those people born in 1917-1921. Individuals in the notch generally receive higher benefits than those born after the notch, although they receive lower benefits than those born in the period prior to the notch when the error was in effect.

Q16: Where can I find the history of the tax rates over the years and the amount of earnings subject to Social Security taxes?

A: The history of the tax rates is available as an Adobe PDF file. (Tax rate table). There is also a table showing the maximum amount of Social Security taxes that could have been paid since the program began.

There are also tables showing the minimum and maximum Social Security benefitfor a retired worker who retires at age 62 and one who retires at age 65.

Also, there is a table showing the number of workers paying into Social Security each year. (Covered workers table) And also a table showing the ratio of covered workers to beneficiaries. (Ratio table)

Q17: What does FICA mean and why are Social Security taxes called FICA contributions?

A: Social Security payroll taxes are collected under authority of the Federal Insurance Contributions Act (FICA). The payroll taxes are sometimes even called “FICA taxes.” In the original 1935 law the benefit provisions were in Title II of the Act and the taxing provisions were in a separate title, Title VIII. As part of the 1939 Amendments, the Title VIII taxing provisions were taken out of the Social Security Act and placed in the Internal Revenue Code. Since it wouldn’t make any sense to call this new section of the Internal Revenue Code “Title VIII,” it was renamed the “Federal Insurance Contributions Act.” So FICA is nothing more than the tax provisions of the Social Security Act, as they appear in the Internal Revenue Code.

Q18: Is there any significance to the numbers assigned in the Social Security Number?

A: Yes. Originally, the first three digits are assigned by the geographical region in which the person was residing at the time he/she obtained a number. Generally, numbers were assigned beginning in the northeast and moving westward. So people on the east coast have the lowest numbers and those on the west coast have the highest numbers. The remaining six digits in the number are more or less randomly assigned and were organized to facilitate the early manual bookkeeping operations associated with the creation of Social Security in the 1930s.

Beginning on June 25, 2011, the SSA implemented a new assignment methodology for Social Security Numbers. The project is a forward looking initiative of the Social Security Administration (SSA) to help protect the integrity of the SSN by establishing a new randomized assignment methodology. SSN Randomization will also extend the longevity of the nine-digit SSN nationwide.

For more information on the randomization of Social Security Numbers, please visit this website:

http://ssa.gov/employer/randomizationfaqs.html#a0=-1

Q19: How many Social Security numbers have been issued since the program started?

A: Social Security numbers were first issued in November 1936. To date, 453.7 million different numbers have been issued.

Q20: Are Social Security numbers reused after a person dies?

A:  No. We do not reassign a Social Security number (SSN) after the number holder’s death. Even though we have issued over 453 million SSNs so far, and we assign about 5 and one-half million new numbers a year, the current numbering system will provide us with enough new numbers for several generations into the future with no changes in the numbering system.

Q21: When did Social Security cards bear the legend “NOT FOR IDENTIFICATION”?

A: The first Social Security cards were issued starting in 1936, they did not have this legend. Beginning with the sixth design version of the card, issued starting in 1946, SSA added a legend to the bottom of the card reading “FOR SOCIAL SECURITY PURPOSES — NOT FOR IDENTIFICATION.” This legend was removed as part of the design changes for the 18th version of the card, issued beginning in 1972. The legend has not been on any new cards issued since 1972.

Q22: Does the Social Security Number contain a code indicating the racial group to which the cardholder belongs?

A: No. This is a myth. The Social Security Number does contain a segment (the two middle numbers) known as “the group number.” But this refers only to the numerical groups 01-99. It has nothing to do with race.

More detailed information on the Group Number:

Apparently due to the fact that the middle digits of the SSN are referred to as the “group number,” some people have misconstrued this to mean that the “group number” refers to racial groupings. So a myth goes around from time-to-time that encoded in a person’s SSN is a key to their race. This simply is not true.

As should be clear from the explanation of the SSN numbering scheme, the “group number” refers only to the numerical groups 01-99. For filing purposes, the “area numbers” are broken down into these numerical subgroups. So, for example, for area numbers starting with 527 there would be 99 subgroups, one for every number starting with 527-01, and one for every number starting with 527-02, and so on. This was done back in 1936 because in that era there were no computers and all the records were stored in filing cabinets. The early program administrators needed some way to organize the filing cabinets into sub-groups, to make them more manageable, and this is the scheme they came up with.

So the “group number” has nothing whatever to do with race.

More detailed information on the Numbering Scheme:

Number Has Three Parts

The nine-digit SSN is composed of three parts:

  • The first set of three digits is called the Area Number
  • The second set of two digits is called the Group Number
  • The final set of four digits is the Serial Number

The Area Number

The Area Number is assigned by the geographical region. Prior to 1972, cards were issued in local Social Security offices around the country and the Area Number represented the State in which the card was issued. This did not necessarily have to be the State where the applicant lived, since a person could apply for their card in any Social Security office. Since 1972, when SSA began assigning SSNs and issuing cards centrally from Baltimore, the area number assigned has been based on the ZIP code in the mailing address provided on the application for the original Social Security card. The applicant’s mailing address does not have to be the same as their place of residence. Thus, the Area Number does not necessarily represent the State of residence of the applicant, either prior to 1972 or since.

Generally, numbers were assigned beginning in the northeast and moving westward. So people on the east coast have the lowest numbers and those on the west coast have the highest numbers.

Note: One should not make too much of the “geographical code.” It is not meant to be any kind of useable geographical information. The numbering scheme was designed in 1936 (before computers) to make it easier for SSA to store the applications in our files in Baltimore since the files were organized by regions as well as alphabetically. It was really just a bookkeeping device for our own internal use and was never intended to be anything more than that.

Group Number

Within each area, the group number (middle two (2) digits) range from 01 to 99 but are not assigned in consecutive order. For administrative reasons, group numbers issued first consist of the ODD numbers from 01 through 09 and then EVEN numbers from 10 through 98, within each area number allocated to a State. After all numbers in group 98 of a particular area have been issued, the EVEN Groups 02 through 08 are used, followed by ODD Groups 11 through 99.

Serial Number

Within each group, the serial numbers (last four (4) digits) run consecutively from 0001 through 9999.

Q23: Has Social Security ever been financed by general tax revenues?

A: Not to any significant extent.

Detailed explanation of the Design of the Original Social Security Act:

The new social insurance program the Committee on Economic Security (CES) was designing in 1934 was different than welfare in that it was a contributory program in which workers and their employers paid for the cost of the benefits–with the government’s role being that of the fund’s administrator, rather than its payer. This was very important to President Roosevelt who signaled early on that he did not want the federal government to subsidize the program–that it was to be “self-supporting.” He would eventually observe: “If I have anything to say about it, it will always be contributed, both on the part of the employer and the employee, on a sound actuarial basis. It means no money out of the Treasury.”

But some members of the CES did not understand “self-supporting” with quite the same purity as the President did. They saw no reason why general revenues could not be used– especially in the context of the overall approach to old-age security. FDR, and the members of the CES, believed that old-age assistance was a temporary stop-gap which would eventually completely disappear as social insurance became established. At a November 27, 1934 meeting the staff displayed a large wall-chart showing two trend lines, one for old-age assistance and one for the social insurance program. The line for old-age assistance was heading down while that for social insurance was heading up. At the point where they intersected, social insurance would have assumed the bulk of the burden of providing old-age security in America. Thus, general revenue expenses for old-age assistance would steadily diminish, thanks to Social Security. The staff reasoned that it was sensible to take a portion of this savings and use it to finance the Social Security program in the out-years–thus keeping payroll tax rates lower than they otherwise would have to be. Using this rationale, the CES proposal presented to FDR contained a tax schedule which financed the program by payroll taxes until 1965, at which point a general revenue subsidy would kick-in. Eventually, under the CES plan, general revenues would finance about one-third of the cost of the benefits.

The Committee’s report was late. It was due to Congress on January 1, 1935 but it was not finished and presented to the President until January 15th. Immediately upon receiving the report the President sent notice to Congress that he would be transmitting the report to them on the 17th, then he sat down to read the report. FDR very carefully went over the actuarial tables and discovered to his surprise that the program was not fully “self- supporting” as he had directed it should be. He summoned Secretary Perkins to the White House on the afternoon of the 16th to tell her that there must be some mistake in the actuarial tables because they showed a large federal subsidy beginning in 1965. When informed that this was no mistake, the President made it clear it was indeed a mistake, although of a different kind! He told the Secretary to get to work immediately to devise a fully self-sustaining old age insurance system. The report was transmitted to the Congress on the 17th as the President had promised, but the actuarial table in question was withdrawn until it could be reworked. Bob Myers, later to be SSA’s Chief Actuary, was given the assignment to rework the financing and the system finally devised projected a $47 billion surplus by 1980–with no general revenue financing.

Detailed explanation of the Beginning of Small General Revenue Subsidies:

And so, Social Security was from its first day of operation a fully self-supporting program, without any general revenue funding. But FDR’s sense of purity was ultimately left behind when Congress voted the first subsidy provisions to be added to Social Security. Ever since World War II it was recognized that there was a problem for people who entered the service of their country in the military. Immediately following World War II Congress passed a brief change to Social Security which provided some small general revenues to pay benefits to WWII veterans who had become disabled in the years immediately following the War and who did not qualify for a veterans benefit. From 1947-1951 a total of $16 million was transferred into the Trust Funds for this purpose.

Since military wages were not covered employment until 1957, spending several years in the military would result in reduced Social Security benefits. Even after military service became a form of covered employment, the low cash wages paid to servicemen and women meant that military service was also a financial sacrifice. As a special benefit for members of the armed forces the Congress decided to grant special non-contributory wage credits for military service before 1957 and special deemed military wage credits to boost the amounts of credited contributions for service after 1956. These credits were paid out of general revenues as a subsidy to military personnel. So, each year since 1966 the Social Security Trust Funds have in fact received some relatively small transfers from the general revenues as bonuses for military personnel.

In 1965-66 Congress also identified another “disadvantaged” group: elderly individuals (age 72 before 1971) who had not been able to work long enough under Social Security to become insured for a benefit. People in this group were granted special Social Security benefits paid for entirely by the general revenues of the Treasury. These were known as Special Age 72, or Prouty, benefits. Over time, of course, these beneficiaries will disappear as Father Time claims members of the group.

Finally, as part of the 1983 Amendments, Social Security benefits became subject to federal income taxes for the first time, and the monies generated by this taxation are returned to the Trust Funds from general revenues–the third and last source of general revenue financing of Social Security.

All three of these general revenue streams are so small relative to the payroll tax funding that for most practical purposes we could still accurately describe the Social Security program as “self-supporting.”

Q24: How much has Social Security paid out since it started?

A: From 1937 (when the first payments were made) through 2009 the Social Security program has expended $11.3 trillion.

Q25: How much has Social Security taken in taxes and other income since it started?

A: From 1937 (when taxes were first collected) through 2009 the Social Security program has received $13.8 trillion in income.

Q26: Has Social Security always taken in more money each year than it needed to pay benefits?

A: No. So far there have been 11 years in which the Social Security program did not take enough in FICA taxes to pay the current year’s benefits. During these years, Trust Fund bonds in the amount of about $24 billion made up the difference.

Q27: Do the Social Security Trust Funds earn interest?

A: Yes they do. By law, the assets of the Social Security program must be invested in securities guaranteed as to both principal and interest. The Trust Funds hold a mix of short-term and long-term government bonds. The Trust Funds can hold both regular Treasury securities and “special obligation” securities issued only to federal trust funds. In practice, most of the securities in the Social Security Trust Funds are of the “special obligation” type. (See additional explanation from SSA’s Office of the Actuary.)

The Trust Funds earn interest which is set at the average market yield on long-term Treasury securities. Interest earnings on the invested assets of the combined OASI and DI Trust Funds were $55.5 billion in calendar year 1999. This represented an effective annual interest rate of 6.9 percent.

The Trust Funds have earned interest in every year since the program began. More detailed information on the Trust Fund investments can be found in the Annual Report of the Social Security Trustees and on the Actuary’s webpages concerning the Investment Transactions and Investment Holdings of the Trust Funds.

Q28: Did President Franklin Roosevelt make a set of promises about Social Security, which have now been violated?

A: This question generally refers to a set of misinformation that is propagated over the Internet (usually via email) from time to time.

More details about Myths:

Myth 1: President Roosevelt promised that participation in the program would be completely voluntary

Persons working in employment covered by Social Security are subject to the FICA payroll tax. Like all taxes, this has never been voluntary. From the first days of the program to the present, anyone working on a job covered by Social Security has been obligated to pay their payroll taxes.

In the early years of the program, however, only about half the jobs in the economy were covered by Social Security. Thus one could work in non-covered employment and not have to pay FICA taxes (and of course, one would not be eligible to collect a future Social Security benefit). In that indirect sense, participation in Social Security was voluntary. However, if a job was covered, or became covered by subsequent law, then if a person worked at that job, participation in Social Security was mandatory.

There have only been a handful of exceptions to this rule, generally involving persons working for state/local governments. Under certain conditions, employees of state/local governments have been able to voluntarily choose to have their employment covered or not covered.

Myth 2: President Roosevelt promised that the participants would only have to pay 1% of the first $1,400 of their annual incomes into the program

The tax rate in the original 1935 law was 1% each on the employer and the employee, on the first $3,000 of earnings. This rate was increased on a regular schedule in four steps so that by 1949 the rate would be 3% each on the first $3,000. The figure was never $,1400, and the rate was never fixed for all time at 1%.

(The text of the 1935 law and the tax rate schedule can be found here.)

Myth 3: President Roosevelt promised that the money the participants elected to put into the program would be deductible from their income for tax purposes each year

There was never any provision of law making the Social Security taxes paid by employees deductible for income tax purposes. In fact, the 1935 law expressly forbid this idea, in Section 803 of Title VIII.

(The text of Title VIII. can be found here.)

Myth 4: President Roosevelt promised that the money the participants paid would be put into the independent “Trust Fund,” rather than into the General operating fund, and therefore, would only be used to fund the Social Security Retirement program, and no other Government program

The idea here is basically correct. However, this statement is usually joined to a second statement to the effect that this principle was violated by subsequent Administrations. However, there has never been any change in the way the Social Security program is financed or the way that Social Security payroll taxes are used by the federal government.

The Social Security Trust Fund was created in 1939 as part of the Amendments enacted in that year. From its inception, the Trust Fund has always worked the same way. The Social Security Trust Fund has never been “put into the general fund of the government.”

Most likely this myth comes from a confusion between the financing of the Social Security program and the way the Social Security Trust Fund is treated in federal budget accounting. Starting in 1969 (due to action by the Johnson Administration in 1968) the transactions to the Trust Fund were included in what is known as the “unified budget.” This means that every function of the federal government is included in a single budget. This is sometimes described by saying that the Social Security Trust Funds are “on-budget.” This budget treatment of the Social Security Trust Fund continued until 1990 when the Trust Funds were again taken “off-budget.” This means only that they are shown as a separate account in the federal budget. But whether the Trust Funds are “on-budget” or “off-budget” is primarily a question of accounting practices–it has no affect on the actual operations of the Trust Fund itself.

Myth 5: President Roosevelt promised that the annuity payments to the retirees would never be taxed as income

Originally, Social Security benefits were not taxable income. This was not, however, a provision of the law, nor anything that President Roosevelt did or could have “promised.” It was the result of a series of administrative rulings issued by the Treasury Department in the early years of the program. (The Treasury rulings can be found here.)

In 1983 Congress changed the law by specifically authorizing the taxation of Social Security benefits. This was part of the 1983 Amendments, and this law overrode the earlier administrative rulings from the Treasury Department. (A detailed explanation of the 1983 Amendments can be found here.)

Q29: I have seen a set of questions and answers on the Internet concerning who started the taxing of Social Security benefits, and questions like that. Are the answers given correct?

A: There are many varieties of questions and answers of this form circulating on the Internet. One fairly widespread form of the questions is filled with misinformation. (See a detailed explanation here.) We recommend that Internet users refer to SSA’s official Questions and Answers section on our homepage for reliable information (go to www.socialsecurity.gov for the Q & A section.)

Immigration And Naturalization Law Through The Years

Americans encouraged relatively free and open immigration during the 18th and early 19th centuries, and rarely questioned that policy until the late 1800s. After certain states passed immigration laws following the Civil War, the Supreme Court in 1875 declared regulation of immigration a federal responsibility. Thus, as the number of immigrants rose in the 1880s and economic conditions in some areas worsened, Congress began to pass immigration legislation.

The Chinese Exclusion Act of 1882 and Alien Contract Labor laws of 1885 and 1887 prohibited certain laborers from immigrating to the United States. The general Immigration Act of 1882 levied a head tax of fifty cents on each immigrant and blocked (or excluded) the entry of idiots, lunatics, convicts, and persons likely to become a public charge.

These national immigration laws created the need for new federal enforcement authorities. In the 1880s, state boards or commissions enforced immigration law with direction from U.S. Treasury Department officials. At the Federal level, U.S. Customs Collectors at each port of entry collected the head tax from immigrants while “Chinese Inspectors” enforced the Chinese Exclusion Act.

Origins of the Federal Immigration Service

The federal government assumed direct control of inspecting, admitting, rejecting, and processing all immigrants seeking admission to the United States with the Immigration Act of 1891. The 1891 Act also expanded the list of excludable classes, barring the immigration of polygamists, persons convicted of crimes of moral turpitude, and those suffering loathsome or contagious diseases.

The national government’s new immigration obligations and its increasingly complex immigration laws required a dedicated federal enforcement agency to regulate immigration. Accordingly, the 1891 Immigration Act created the Office of the Superintendent of Immigration within the Treasury Department. The Superintendent oversaw a new corps of U.S. Immigrant Inspectors stationed at the country’s principal ports of entry.

Federal Immigration Stations – On January 2, 1892, the Immigration Service opened the U.S.’s best known immigration station on Ellis Island in New York Harbor. The enormous station housed inspection facilities, hearing and detention rooms, hospitals, cafeterias, administrative offices, railroad ticket offices, and representatives of many immigrant aid societies. America’s largest and busiest port of entry for decades, Ellis Island station employed 119 of the Immigration Service’s entire staff of 180 in 1893.

The Service built additional immigrant stations at other principal ports of entry through the early 20th century. At New York, Boston, Philadelphia, and other traditional ports of entry, the Immigration Service hired many Immigrant Inspectors who previously worked for state agencies. At other ports, both old and new, the Service built an Inspector corps by hiring former Customs Inspectors and Chinese Inspectors, and training recruits.

Implementing A National Immigration Policy – During its first decade, the Immigration Service formalized basic immigration procedures and made its first attempts to enforce a national immigration policy. The Immigration Service began collecting arrival manifests (also frequently called passenger lists or immigration arrival records) from each incoming ship, a former duty of the U.S. Customs Service since 1820. Inspectors then questioned arrivals about their admissibility and noted their admission or rejection on the manifest records.

Beginning in 1893, Inspectors also served on Boards of Special Inquiry that closely reviewed each exclusion case. Inspectors often initially excluded aliens who were likely to become public charges because they lacked funds or had no friends or relatives nearby. In these cases, the Board of Special Inquiry usually admitted the alien if someone could post bond or one of the immigrant aid societies would accept responsibility for the alien.

Detention guards and matrons cared for detained persons pending decisions in their cases or, if the decision was negative, awaiting deportation. The Immigration Service deported aliens denied admission by the Board of Special Inquiry at the expense of the transportation company that brought them to the port.

Enhanced Responsibilities – Congress continued to exert Federal control over immigration with the Act of March 2, 1895, which promoted the Office of Immigration to the Bureau of Immigration and changed the agency head’s title from Superintendent to Commissioner-General of Immigration. The Act of June 6, 1900, consolidated immigration enforcement by assigning enforcement of both Alien Contract Labor laws and Chinese Exclusion laws to the Commissioner-General.

Because most immigration laws of the time sought to protect American workers and wages, an Act of February 14, 1903, transferred the Bureau of Immigration from the Treasury Department to the newly created Department of Commerce and Labor. An “immigrant fund” created from collection of immigrants’ head tax financed the Immigration Service until 1909, when Congress replaced the fund with an annual appropriation.

Origins of the Federal Naturalization Service

At the beginning of the 20th century, federal attention next turned to standardizing naturalization procedures nationwide. Congress previously delegated its constitutional authority to establish “an uniform Rule of Naturalization” to the judiciary for over a century. Under the decentralized system established by the Naturalization Act of 1802, “any court of record” – Federal, state, county, or municipal – could naturalize a new American citizen. In 1905, a commission charged with investigating naturalization practice reported an alarming lack of uniformity among the nation’s more than 5,000 naturalization courts. Individual courts exercised naturalization authority without central supervision and with little guidance from Congress concerning the proper interpretation of its naturalization laws. Each court determined its own naturalization requirements, set its own fees, followed its own naturalization procedures, and issued its own naturalization certificate. This absence of uniformity made confirming a person’s citizenship status very difficult, resulting in widespread naturalization fraud. The naturalization of large groups of aliens before elections caused particular concern.

Standardizing Naturalization Nationwide – Congress enacted the Basic Naturalization Act of 1906 to restore dignity and uniformity to the naturalization process. The 1906 law framed the fundamental rules that governed naturalization for most of the 20th century. That legislation also created the Federal Naturalization Service to oversee the nation’s naturalization courts. Congress placed this new agency in the Bureau of Immigration, expanding it into the Bureau of Immigration and Naturalization.

To normalize naturalization procedures, the Basic Naturalization Act of 1906 required standard naturalization forms and encouraged state and local courts to give up their naturalization jurisdiction to federal courts. To prevent fraud, the new federal Naturalization Service collected copies of every naturalization record issued by every naturalization court across the country. Bureau officials also checked immigration records to verify each applicant’s legal admission into the United States.

The Independent Bureau of Naturalization – In 1913, the Naturalization Service began its two decades as an independent Bureau. That year saw the Department of Commerce and Labor divided into separate cabinet departments and the Bureau of Immigration and Naturalization split into the Bureau of Immigration and the Bureau of Naturalization. The two bureaus coexisted separately within the new Department of Labor until reunited as the Immigration and Naturalization Service (INS) in 1933.

Encouraging Citizenship – A grassroots Americanization movement popular before World War I influenced developments in the Naturalization Bureau during the 1920s. The Bureau published its first Federal Textbook on Citizenship in 1918 to prepare naturalization applicants. Its Education for Citizenship program distributed the textbooks to public schools offering citizenship education classes and notified eligible aliens of available education opportunities.

Increasing Oversight of Naturalization Courts – Legislation of 1926 established the designated examiner system which assigned a Naturalization Examiner to each federal naturalization court. The Naturalization Examiners interviewed applicants, made recommendations to judges, and monitored proceedings. This direct interaction with the courts further advanced the fairness and uniformity of the naturalization process nationwide.

Mass Immigration and WWI

The Immigration Service continued evolving as the United States experienced rising immigration during the early years of the 20th century. Between 1900 and 1920 the nation admitted over 14.5 million immigrants.

Concerns mass immigration and its impact on the country began to change Americans’ historically open attitude toward immigration. Congress strengthened national immigration law with new legislation in 1903 and 1907. Meanwhile, a Presidential Commission investigated the causes of massive emigration out of Southern and Eastern Europe and the Congressional Dillingham Commission studied conditions among immigrants in the United States. These commissions’ reports influenced the writing and passage of the Immigration Act of 1917.

Among its other provisions, the 1917 Act required that immigrants be able to read and write in their native language, obligating the Immigration Service to begin administering literacy tests. Another change, the introduction of pre-inspection and more-rigorous medical examinations at the point of departure saved time for people passing through some American ports of entry and reduced the number of excluded immigrants.

Wartime Challenges – The outbreak of World War I greatly reduced immigration from Europe but also imposed new duties on the Immigration Service. Internment of enemy aliens (primarily seamen who worked on captured enemy ships) became a Service responsibility. Passport requirements imposed by a 1918 Presidential Proclamation increased agency paperwork during immigrant inspection and deportation activities. The passport requirement also disrupted routine traffic across United States’ land borders with Canada and Mexico. Consequently, the Immigration Service began to issue Border Crossing Cards.

Era of Restriction

Mass immigration resumed after the First World War. Congress responded with a new immigration policy, the national origins quota system. Established by Immigration Acts of 1921 and 1924, the national origins system numerically limited immigration for the first time in United States history. Each nationality received a quota based on its representation in past United States census figures. The State Department distributed a limited number of visas each year through U.S. Embassies abroad and the Immigration Service only admitted immigrants who arrived with a valid visa.

Birth of the Border Patrol and Board of Review – Severely restricted immigration often results increased illegal immigration. In response to rising numbers of illegal entries and alien smuggling, especially along land borders, in 1924 Congress created the U.S. Border Patrol within the Immigration Service.

The strict new immigration policy coupled with Border Patrol successes shifted more agency staff and resources to deportation activity. Rigorous enforcement of immigration law at ports of entry also increased appeals under the law. This led to creation of the Immigration Board of Review within the Immigration Bureau in the mid-1920s. (The Board of Review became the Board of Immigration Appeals after moving to the Justice Department in the 1940s, and since 1983 has been known as the Executive Office of Immigration Review (EOIR).)

United Immigration and Naturalization Service (INS) – Executive Order 6166 of June 10, 1933, reunited the Bureau of Immigration and Bureau of Naturalization into one agency, the Immigration and Naturalization Service. Consolidation resulted in significant reduction of the agency’s workforce achieved through merit testing and application of Civil Service examination procedures.

The agency’s focus shifted towards law enforcement as immigration volume dropped significantly during the Great Depression. Through the 1930s, INS dedicated more resources to investigation, exclusion, prevention of illegal entries, deportation of criminal and subversive aliens, and cooperating closely with the Department of Justice’s United States Attorneys and Federal Bureau of Investigation (FBI) in prosecuting violations of immigration and nationality laws.

World War II

The threat of war in Europe, and a growing view of immigration as a national security rather than an economic issue, reshaped the Immigration and Naturalization Service’s (INS) mission. In 1940, Presidential Reorganization Plan Number V moved the INS from the Department of Labor to the Department of Justice.

The United States’ entry into World War II brought additional change as many Service personnel enlisted in the Armed Forces. This left INS short of experienced staff. At the same time, INS Headquarters temporarily moved to Philadelphia for the course of the war.

Aiding the War Effort – New national security duties led to the INS’ rapid growth through World War II. The agency’s workforce doubled from approximately 4,000 to 8,000 employees as INS instituted the following programs in support of the war effort:

  • Recording and fingerprinting every alien in the United States through the Alien Registration Program;
  • Organizing and operating internment camps and detention facilities for enemy aliens;
  • Increased Border Patrol operations;
  • Record checks related to security clearances for immigrant defense workers; and
  • Administration of a program to import agricultural laborers to harvest the crops left behind by American workers who went to war.

During the war the INS was relieved the responsibility of enforcing the Chinese Exclusion Act, which Congress repealed in 1943. Other war-time developments included conversion to a new record-keeping system and implementation of the Nationality Act of 1940.

Post-War Years

Immigration remained relatively low following World War II because the numerical limitations imposed by the 1920s national origins system remained in place. However, humanitarian crises spawned by the conflict and United States burgeoning international presence in the post-war world brought new challenges for the Immigration and Naturalization Service (INS).

Providing Humanitarian Relief – Many INS programs in the 1940s and 1950s addressed individuals affected by conditions in postwar Europe. The Displaced Persons Act of 1948 and Refugee Relief Act of 1953 allowed for admission of many refugees displaced by the war and unable to come to the United States under regular immigration procedures. With the onset of the Cold War, the Hungarian Refugee Act of 1956, Refugee Escapee Act of 1957, and Cuban Adjustment Program of the 1960s served the same purpose for “escapees” from communist countries. Other post-war INS programs facilitated family reunification. The War Brides Act of 1945 and the Fiancées Act of 1946 eased admission of the spouses and families of returning American soldiers.

The Bracero Program – The World War II temporary worker program continued after the war under a 1951 formal agreement between Mexico and the United States. Like its wartime predecessor the Mexican Agricultural Labor Program (“MALP”), commonly called the “Bracero Program,” matched seasonal agricultural workers from Mexico with approved American employers. Between 1951 and 1968, hundreds of thousands of braceros entered the country each year as non-immigrant laborers.

Enforcing Immigration Laws – By the mid-1950s, INS enforcement activities focused on two areas of national concern. Public alarm over illegal aliens resident and working in the United States caused the Service to strengthen border controls and launch targeted deportation programs including the controversial “Operation Wetback,” a 1954 Mexican Border enforcement initiative. Additional worry over criminal aliens within the country prompted INS investigation and deportation of communists, subversives, and organized crime figures.

Reforming Immigration Policy – Congress re-codified and combined all previous immigration and naturalization law into the Immigration and Nationality Act (INA) of 1952. The 1952 law removed all racial barriers to immigration and naturalization and granted the same preference to husbands as it did to wives of American citizens. However, the INA retained the national origins quotas.

In 1965 amendments to the 1952 immigration law, Congress replaced the national origins system with a preference system designed to reunite immigrant families and attract skilled immigrants to the United States. This change to national policy responded to changes in the sources of immigration since 1924. By the mid-20th century, the majority of applicants for immigration visas came from Asia and Central and South America rather than Europe. The preference system continued to limit the number of immigration visas available each year, however, and Congress still responded to refugees with special legislation, as it did for Indochinese refugees in the 1970s. Not until the Refugee Act of 1980 did the United States have a general policy governing the admission of refugees.

Late 20th Century

As in the past, the Immigration and Naturalization Service (INS) adapted to new challenges which emerged during the 1980s and 90s. Changes in world migration patterns, the ease of modern international travel, and a growing emphasis on controlling illegal immigration all shaped the development of INS through the closing decades of the 20th century.

Adopting New Approaches to Immigration Law Enforcement – INS’s responsibilities expanded under the Immigration Reform and Control Act (IRCA) of 1986. IRCA charged the INS with enforcing sanctions against United States employers who hired undocumented aliens. Carrying out employer sanction duties involved investigating, prosecuting, and levying fines against corporate and individual employers, as well as deportation of those found to be working illegally. The 1986 law also allowed certain aliens illegally in the U.S. to legalize their residence. INS administered that legalization program.

The Immigration Act of 1990 (IMMACT 90) retooled the immigrant selection system once again. IMMACT 90 increased the number of available immigrant visas and revised the preference categories governing permanent legal immigration. Immigrant visas were divided into 3 separate categories: family-sponsored, employment-based, and “diversity” immigrants selected by lottery from countries with low immigration volumes.

The 1990 Act also established an administrative procedure for naturalization and ended judicial naturalization. Under the act, authorized INS administrative officials could grant or deny naturalization petitions.

Dawning of a New Millennium – The INS workforce, which numbered approximately 8,000 from World War II through the late 1970s, increased to more than 30,000 employees in thirty-six INS districts at home and abroad by turn of the 21st century. The original force of Immigrant Inspectors evolved into a corps of specialist officers focused on individual elements of the agency’s mission. As it entered its second century, INS employees:

  • Enforced laws providing for selective immigration and controlled entry of tourists, business travelers, and other temporary visitors;
  • Inspected and admitted arrivals at land, sea, and air ports of entry;
  • Administered benefits such as naturalization and permanent resident status;
  • Granted asylum to refugees;
  • Patrolled the nation’s borders; and
  • Apprehended and removed aliens who entered illegally, violated the requirements of their stay, or threatened the safety of the people of the United States.

Post-9/11

The events of September 11, 2001, injected new urgency into INS’ mission and initiated another shift in the United States’ immigration policy. The emphasis of American immigration law enforcement became border security and removing criminal aliens to protect the nation from terrorist attacks. At the same time the United States retained its commitment to welcoming lawful immigrants and supporting their integration and participation in American civic culture.

The Homeland Security Act of 2002 disbanded INS on March 1, 2003. Its constituent parts contributed to 3 new federal agencies serving under the newly-formed Department of Homeland Security (DHS):

  1. Customs and Border Protection (CBP),
  2. Immigration and Customs Enforcement (ICE), and
  3. U.S. Citizenship and Immigration Services (USCIS).

CBP prevents drugs, weapons, and terrorists and other inadmissible persons from entering the country. ICE enforces criminal and civil laws governing border control, customs, trade, and immigration. USCIS oversees lawful immigration to the United States and naturalization of new American citizens. Although now separate, these agencies continue to cooperate, benefitting from and building upon the legacy of INS.

State Minimum Wage Laws

While the Federal minimum wage is $7.25, different state governments have different laws regulating the minimum wage within that state. The map below from the Department of Labor shows which states have minimum wage laws above the federal level, at the federal level, no minimum wage laws, or minimum wage laws below the federal level.

The state minimum wage rate requirements, or lack thereof, are generally controlled by legislative activities within the individual states.

Federal minimum wage law supersedes state minimum wage laws where the federal minimum wage is greater than the state minimum wage. In those states where the state minimum wage is greater than the federal minimum wage, the state minimum wage prevails.

There are 2 states than have a minimum wage set lower than the federal minimum wage. There are 29 states plus the District of Columbia with minimum wage rates set higher than the federal minimum wage. There are 14 states that have a minimum wage requirement that is the same as the federal minimum wage requirement. The remaining 5 states do not have an established minimum wage requirement.

The District of Columbia has the highest minimum wage at $11.50/hour. The states of Georgia and Wyoming have the lowest minimum wage ($5.15/hour) of the 45 states that have a minimum wage requirement.


Note: There are 12 states (AK, AZ, CO, FL, MO, MT, NJ, NV, OH, OR, SD, and WA) that have minimum wages that are linked to a consumer price index. As a result of this linkage, the minimum wages in these states are normally increased each year, generally around January 1st. The exception is Nevada which adjusts in the month of July each year. Effective January 1, 2017, seven (7) of the 12 states increased their respective minimum wages.