Tag: Medicare

The Next Big Fight Of Social Security, Medicare, And Medicaid

Fresh off passing massive tax cuts for corporations and the wealthy, Trump and congressional Republicans want to use the deficit they’ve created to justify huge cuts to Social Security, Medicare, and Medicaid.

As House Speaker Paul Ryan says “We’re going to have to get… at entitlement reform, which is how you tackle the debt and the deficit.”

Don’t let them get away with it.

Social Security and Medicare are critical safety-nets for working and middle-class families.

Before they existed, Americans faced grim prospects. In 1935, the year Social Security was enacted, roughly half of America’s seniors lived in poverty.  By the 1960s poverty among seniors had dropped significantly, but medical costs were still a major financial burden and only half of Americans aged 65 and over had health insurance. Medicare fixed that, guaranteeing health care for older Americans.

Today less than 10 percent of seniors live in poverty and almost all have access to health care. According to an analysis of census data, Social Security payments keep an estimated 22 million Americans from slipping into poverty.

Medicaid is also a vital lifeline for America’s elderly and the poor. Yet the Trump administration has already started whittling it away by encouraging states to impose work requirements on Medicaid recipients.

Republicans like to call these programs “entitlements,” as if they’re some kind of giveaway.  But Americans pay into Social Security and Medicare throughout their entire working lives. It’s Americans’ own money they’re getting back through these programs.

These vital safety nets should be strengthened, not weakened. How?

1. Lift the ceiling on income subject to the Social Security tax. Currently, top earners only pay Social Security taxes on the first $120,000 of their yearly income. So the rich end up, in effect,  paying a lower Social Security tax rate than everyone else. Lifting the ceiling on what wealthy Americans contribute would help pay for the Baby Boomers retirements and leave Social Security in good shape for Millennials.

2. Allow Medicare to negotiate with drug companies for lower prescription drug prices. As the nation’s largest insurer, Medicare has tremendous bargaining power. Why should Americans pay far more for drugs than people in any other country?

3. Finally, reduce overall health costs and create a stronger workforce by making Medicare available to all. There’s no excuse for the richest nation in the world to have 28 million Americans still uninsured.

We need to not just secure, but revitalize Social Security and these other programs for our children, and for our children’s children.  Millennials just overtook Baby Boomers as our nation’s largest demographic.  For them — for all of us — we need to say loud and clear to all of our members of congress:  Hands off Medicare, Medicaid, and Social Security. Expand and improve these programs: don’t cut them.

Long-Term Projections Of Social Security’s And Medicare’s Financing Are Not As Scary As They Seem

With the release of the annual Social Security and Medicare trustees’ report, President Trump’s appointees endorsed sharp improvements in Medicare’s financing that occurred under former President Obama. Medicare had a projected shortfall of 3.54 percent of covered payroll (over a 75-year planning period) during the last year of the Bush administration, now it is down to just 0.64 percent.

This development should give pause to those who wish to fundamentally restructure Social Security and Medicare based on these projections. A lot changed over the eight years of the Obama administration and even more can change over 75 years. This is worth taking into account when looking at Social Security’s 75-year shortfall, which is at 2.83 percent of payroll under the intermediate scenario.

The figure below compares the tax increase that would be required to fully fund Social Security — 2.83 percent — with the projected increase in average wages over the next 30 years. The tax increase is dwarfed by the increase in wages over this period, which would be 49.4 percent by the trustees’ own estimates. Wage increases are over 17 times more important than the tax increase.


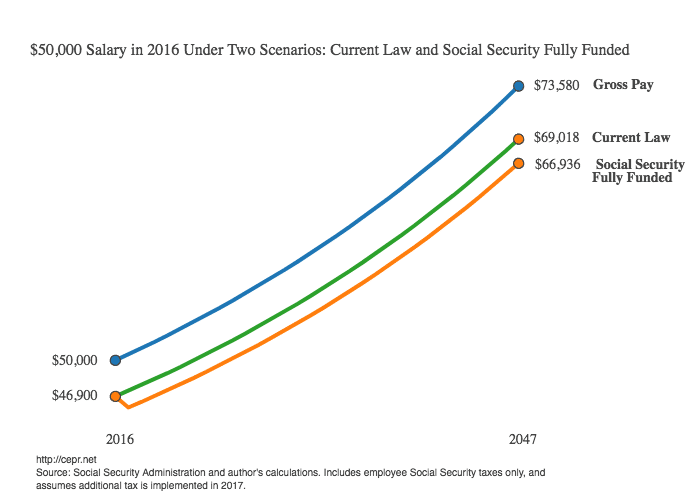
The next figure is a simple projection of what would happen to a salary of $50,000 per year in 2016 ($46,900 with the current Social Security taxes taken out) over the same 30-year period. With the current Social Security tax rate, this salary would be $69,018 per year in 2047 based on the average wage increase. With Social Security fully funded, it would be $66,936.


It’s unlikely that these projections will hold over such a long time frame, but this should demonstrate that workers should be much more concerned with making sure they receive their share of productivity gains in wage increases over this period than they should be about tax increases. This is not about Social Security needing to be less generous, it is about making sure that workers receive their fair share.

In fact, this problem cuts the other way as well. Unlike Medicare taxes which apply to entire incomes, Social Security taxes apply only up to a threshold — the payroll tax cap — which was set at $127,200 in 2017. With the upward redistribution of income that has occurred over the last four decades, Social Security has less of a base on which to draw. 90 percent of wage income was subject to the tax in 1983 — it was 82.6 percent in 2015. This decline represents a large share of the program’s shortfall.

For Social Security, as with Medicare, long-term financing problems are not indicative of inherent or intractable problems with social programs. Rather, they are indicative of other problems, like policies that redistribute income upwards, and they are fixable.

National Health Expenditures 2015 Highlights

In 2015, U.S. health care spending increased 5.8 percent to reach $3.2 trillion, or $9,990 per person. The coverage expansion that began in 2014 as a result of in the Affordable Care Act continued to have an impact on the growth of health care spending in 2015. Additionally, faster growth in total health care spending in 2015 was driven by stronger growth in spending for private health insurance, hospital care, physician and clinical services, and the continued strong growth in Medicaid and retail prescription drug spending. Lastly, the overall share of the U.S. economy devoted to health care spending was 17.8 percent in 2015, up from 17.4 percent in 2014.

Health Spending by Type of Service or Product:

Hospital Care (32 percent share): Spending for hospital care increased 5.6 percent to $1.0 trillion in 2015 compared to 4.6 percent growth in 2014. The faster growth in 2015 was driven by continued growth in non-price factors such as the use and intensity of services. However, hospital price growth was just 0.9 percent in 2015, which was the lowest rate of growth since 1998. Hospital services, from a payer perspective, experienced faster growth in Medicaid and private health insurance spending; however this strong growth was slightly offset by slower growth in Medicare hospital spending.

Physician and Clinical Services (20 percent share): Spending on physician and clinical services increased 6.3 percent in 2015 to $634.9 billion. This was an acceleration from growth of 4.8 percent in 2014 and was the first time since 2005 that the growth rate exceeded 6.0 percent. As with hospitals, the faster growth in overall physician and clinical services spending was driven by continued growth in non-price factors. Price growth for physician and clinical services, however, declined 1.1 percent in 2015, driven by the expiration of temporary increases in Medicaid payments to primary care physicians.

Other Professional Services (3 percent share): Spending for other professional services reached $87.7 billion in 2015, an increase of 5.9 percent and an acceleration from growth of 5.1 percent in 2014. Spending in this category includes establishments of independent health practitioners (except physicians and dentists) that primarily provide services such as physical therapy, optometry, podiatry, or chiropractic medicine.

Dental Services (4 percent share): Spending for dental services increased 4.2 percent in 2015 to $117.5 billion, which was an acceleration from 2.4 percent growth in 2014. Out-of-pocket spending for dental services (which accounted for 40 percent of dental spending) increased 1.8 percent in 2015 after increasing 0.8 percent in 2014. Private health insurance (which accounted for 47 percent of dental spending) increased 3.0 percent in 2015 following 2.1 percent growth in 2014.

Other Health, Residential, and Personal Care Services (5 percent share): Spending associated with other health, residential, and personal care services grew 7.8 percent in 2015 to $163.3 billion after increasing 5.0 percent in 2014. The robust growth was driven by 10.0 percent growth in Medicaid spending, which represented nearly 57 percent of all spending in this category. This category includes expenditures for medical services that are generally delivered by providers in non-traditional settings such as schools, community centers, and the workplace; as well as by ambulance providers and residential mental health and substance abuse facilities.

Home Health Care (3 percent share): Spending growth for freestanding home health care agencies accelerated in 2015, increasing 6.3 percent to $88.8 billion following growth of 4.5 percent in 2014. Stronger growth in both Medicare (2.6 percent) and Medicaid (6.0 percent) spending — the two largest payers which accounted for 76 percent of home health spending — along with faster growth in private health insurance and out-of-pocket spending drove the overall acceleration in 2015.

Nursing Care Facilities and Continuing Care Retirement Communities (5 percent share): Spending for freestanding nursing care facilities and continuing care retirement communities increased 2.7 percent in 2015 to $156.8 billion. The slightly faster growth in 2015 (from 2.3 percent growth in 2014) was mainly due to the faster growth in Medicare spending of 5.6 percent versus 2.5 percent in 2014.

Prescription Drugs (10 percent share): Retail prescription drug spending decelerated in 2015, increasing 9.0 percent to $324.6 billion. Although growth in 2015 was slower than the 12.4 percent growth in 2014, spending on prescription drugs outpaced all other services in 2015. The strong spending growth for prescription drugs is attributed to the increased spending on new medicines, price growth for existing brand name drugs, increased spending on generics, and fewer expensive blockbuster drugs going off-patent.

Durable Medical Equipment (2 percent share): Retail spending for durable medical equipment, which includes items such as contact lenses, eyeglasses and hearing aids, reached $48.5 billion in 2015, and increased 3.9 percent, slightly faster than the 3.5 percent growth in 2014.

Other Non-durable Medical Products (2 percent share): Retail spending for other nondurable medical products, such as over-the-counter medicines, medical instruments, and surgical dressings, grew 3.7 percent to $59.0 billion in 2015.

Health Spending by Major Sources of Funds:

Medicare (20 percent share): Medicare spending grew 4.5 percent to $646.2 billion in 2015, which was a slight deceleration from the 4.8 growth percent in 2014. The slightly slower growth in 2015 was largely attributable to slower growth in Medicare enrollment, which increased 2.7 percent to 54.3 million beneficiaries following 3.1 percent growth in 2014.

Medicaid (17 percent share): Total Medicaid spending slowed slightly in 2015 to 9.7 percent, but continued the strong growth that began in 2014 (11.6 percent) State and local Medicaid expenditures grew 4.9 percent while Federal Medicaid expenditures increased 12.6 percent in 2015. The increased spending by the federal government was largely driven by newly eligible enrollees under the ACA, which were fully financed by the federal government.

Private Health Insurance (33 percent share): Total private health insurance expenditures increased 7.2 percent to $1.1 trillion in 2015, faster than the 5.8 percent growth in 2014. The acceleration in 2015 was driven by increased enrollment and strong growth in benefit spending.

Out-of-Pocket (11 percent share): Out-of-pocket spending grew 2.6 percent in 2015 to $338.1 billion, slightly faster than the growth of 1.4 percent in 2014. The increase in 2015 was influenced by the expansion of insurance coverage and the corresponding drop in the number of individuals without health insurance.

Health Spending by Type of Sponsor:

In 2015, the federal government accounted for the largest share of health care spending (29 percent), followed by households (28 percent), private businesses (20 percent), and state and local governments (17 percent).

Federal government spending on health increased 8.9 percent in 2015 after growing 11.0 percent in 2014, and outpaced all other sponsors of health care in both years. In 2015, the federal government was the largest sponsor of health care at 29 percent, up from 28 percent in 2014 and 26 percent in 2013. The main driver for the increased federal share of health care was the continued enrollment of newly eligible adults into Medicaid, who were fully financed by the federal government.

Health spending by households grew at a rate of 4.7 percent, which was an acceleration from 2.6 percent in 2014. Household spending accounted for 28 percent of health care spending in 2015, unchanged from the year before. The faster growth in spending by households was driven largely by households’ contributions to employer-sponsored private insurance premiums.

State and local government spending increased 4.6 percent in 2015 compared to 3.2 percent growth in 2014. The acceleration was largely driven by faster growth in state and local Medicaid spending which resulted from increased reimbursement rates and an increased effort to expand care in the home and community setting. Overall, state and local government health care spending represented 17 percent of total health care spending in both 2014 and 2015.

Health care spending financed by private businesses accelerated slightly, increasing 5.3 percent in 2015 compared to 4.7 percent growth in 2014. The private business share of overall health spending has remained fairly steady since 2010, at about 20 percent.

Note: Type of sponsor is defined as the entity that is ultimately responsible for financing the health care bill, such as private businesses, households, and governments. These sponsors pay health insurance premiums and out-of-pocket costs, or finance health care through dedicated taxes and/or general revenues.

Entitlements Hysteria

One of the unshakable myths of the punditariat is that the federal government is going bankrupt because of entitlements spending, especially spending on Medicare and Medicaid. Each day we hear the drumbeat saying that either we cut entitlements now or we are finished as a nation. This is a stampede of unreason, contradicted by the facts.

Look at the new budget released at the beginning of the week. Table S-6 on page 212 is the operative page. According to the President’s budget, Medicare and Medicaid would rise slightly from 5.1 percent of GDP in 2011 to 5.5 percent of GDP in 2020. Not exactly the stuff of deficit cataclysm.

So what is the source of the hysteria? Some of it is simply propaganda, by those with the political agenda to gut the country’s social safety net.

But there is something else. Confusion! The punditocracy is repeating the results of forecasts that indeed suggest calamity, but calamity in the late 21st century, not now. These long-term forecasts are arbitrary but have been repeated as an immutable fact by those who don’t read the fine print. The most frequently quoted forecast is that of the Congressional Budget Office.

The CBO’s long-term forecast assumes that health care costs will continue to rise steeply during the next 70 years, though at a diminishing rate. If healthcare costs continue to soar for decades to come, then yes, lo-and-behold, the government would eventually go broke. Federal spending on health care would reach around 25 percent of GNP in 2085.

Yet somehow I’m not ready to panic about the health care costs as of 2085. Mechanical extrapolations that assume that health care costs will rise much faster than GNP between 2011 and 2085 are utterly unconvincing. Why should healthcare costs continue to rise so far and fast when healthcare costs are already vastly over-priced now compared with what other countries pay for the same services? Why should we assume failure decade after decade to use the new information technologies to lower the costs of health-care delivery and administration?

In fact, the recent trends are mildly favorable. As J. D. Keinke of the American Enterprise Institute writes today in the Wall Street Journal, the idea of runaway health spending is a “myth” because “new data show that health spending over the past several years has been normalizing toward the rate of general inflation, rather than growing higher and higher, as had been the case almost continuously since the 1970s.”

Public outrage and market pressures are gradually prevailing over the health-care lobby. American households will ultimately get the care they need much nearer to the lower prices that most other countries pay. Even if we don’t get all the way down to the lower costs that we should have, there is no reason to assume that health care costs will continue to soar year in and year out for another seven decades.

Let’s therefore fight the… hysteria demanding immediate and harsh cuts in Medicaid and other health outlays. We do not need to cut off the lifeline of the poor and elderly. We simply need to keep up the pressure against the healthcare lobbies, and resist the panic of the punditariat