Tag: Polling

Healthcare Polling Data

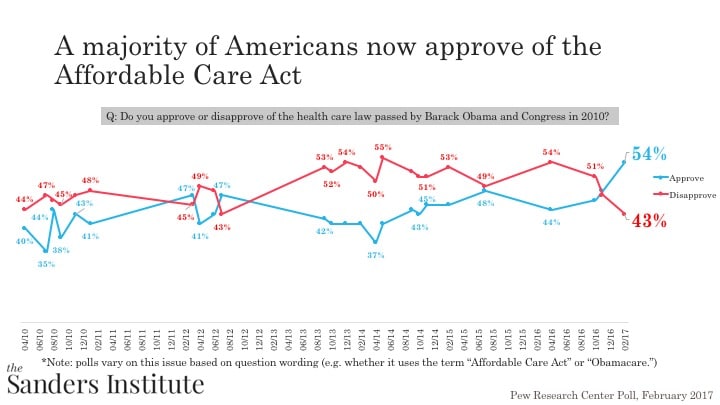
Opinions of the Affordable Care Act (also known as Obamacare) have fluctuated since it was first signed into law in 2010.

It has been the topic of many high-profile court cases and was a key issue in the 2016 Presidential campaign. For the most part, at least a plurality of the American public has disapproved of the ACA since its passage into law. The two outliers are during 2012, which coincides with the 2012 presidential election, and right now. In fact, more Americans approve of the ACA right now (54%) than they ever have.


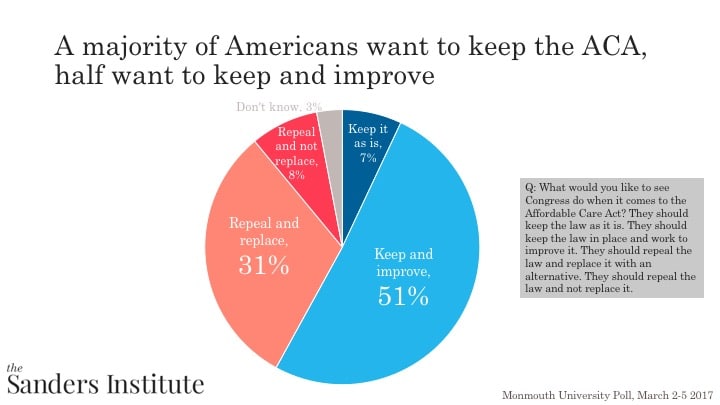
When asked what they would like Congress to do with the law, almost six in ten (58%) Americans want to either keep the law as it is (7%) or keep the law and improve it (51%). In contrast, four in ten (39%) Americans would like to either repeal and replace the law (31%) or repeal with no replacement (8%).


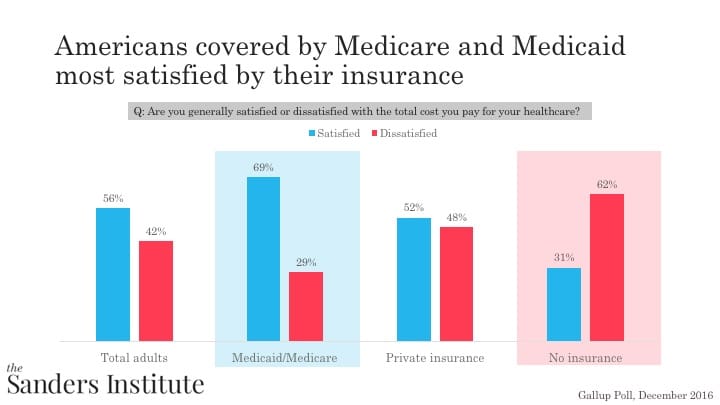
Ultimately, over half (56%) of Americans are satisfied with the cost they pay for insurance. However, the type of insurance is a strong determinant of satisfaction – seven in ten (69%) of individuals on the government programs Medicare and Medicade are satisfied with the cost they pay for insurance, while half (52%) those on private insurance are satisfied and only three in ten (31%) of those without insurance are satisfied.


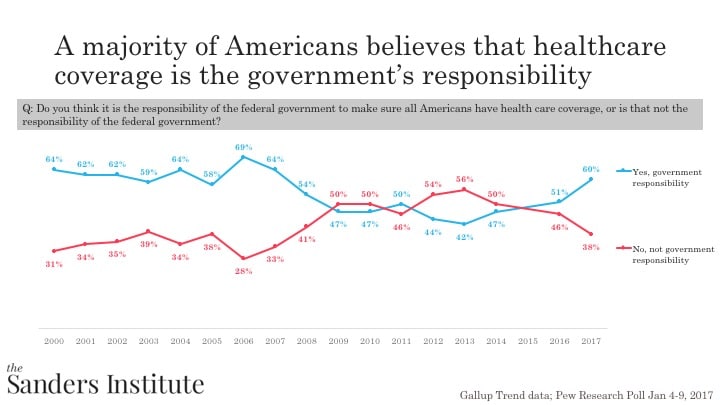
Opininons about whether healthcare coverage is the government responsibility have fluctuated over the years: from 2000 to 2008, a majority of Americans believed that healthcare coverage is the government’s responsibility. Between 2009 and 2016 opinions fluctuated. However, since 2016 there has  been a sharp spike in the number of individuals who think it is the government’s responsibility (60% currently).


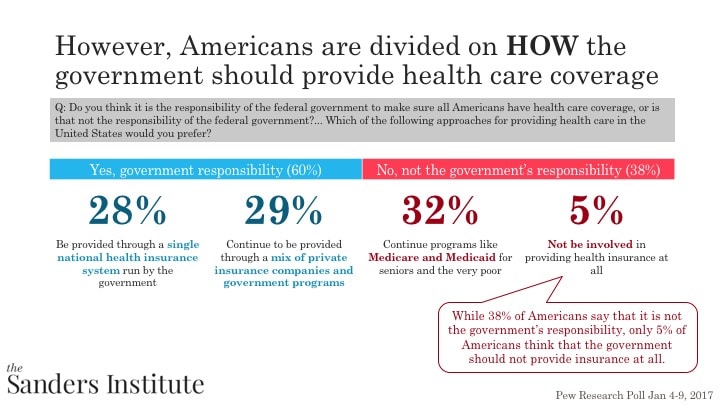
When asked to elaborate about how the government should or should not provide health care coverage, Americans are divided. When looking at those who said that healthcare coverage is the government’s responsibility, Americans are divided half and half. 28% of Americans think that the government should provide healthcare through a single payer system while 29% think that the government should provide healthcare through a mix of private insurance companies and government programs. In contrast, when we look at those who think that it is not the government’s responsibility to provide health care (38%), most want to maintain current programs like Medicaid and Medicare (32% of Americans). In fact, only 5% of Americans would think that the government should not be responsible for healthcare at all.


Union Membership Data And Polling

Union membership (looking at both public and private sector membership) has declined since1983, the first year for which comparable union data are available. In 2016, 10.7% of both private and public sector workers were members of unions. This percentage has declined since 1983 when union members made up 20.1% of the workforce.


States with higher union membership than the national average tend to be states in the Northeast and West while states with lower union membership than the national average tend to be in the Midwest and South. The states with the highest union membership are New York (23.6%) and Hawaii (19.9%) while the states with the lowest union membership are South Carolina (1.6%) and North Carolina (3%).


Union membership varies greatly between the public and private sectors. Union membership in the private sector is 6.4% while union membership is 5 times that in the public sector (34.4%). The most unionized professions in the private sector are utilities (21.5%) and transportation and warehousing (18.4%). The most unionized professions in the public sector is the local government where over four in ten workers are part of a union.


Union membership differs by certain demographics. Men (11.2%) are slightly more likely to be a union member than women (10.2%). African Americans (13%) are the most unionized race/ethnicity, followed by white (10.5%), Asian (9%), and Hispanic (8.8%) workers. Finally, full time workers (11.8%) are more likely to be unionized than part time workers (5.7%).


Union workers’ median weekly earnings of $1,004 a week are 20% higher than the median weekly earnings of non-union workers ($802).


PUBLIC OPINIONS OF UNIONS

A majority of Americans (56%) approve of unions. However, this is lower than it has been in the past. Union approval was highest in the 50s with 75% approval in 1953 and 74% in 1957. After the 50s, union approval decreased. It reached its lowest point in 2009 when a plurality (48%) of Americans approved of unions, only slightly more than the 43% who disapproved of unions. Since that low point, union approval has increased to its current level at 56%.


Despite a majority of Americans approving of unions, Americans are divided on how much influence unions should have. A slight plurality think that unions should have more influence (36%) while only slightly fewer think that unions should have less influence (34%), and only slightly more than a quarter of Americans (26%) think that unions should have the same amount of influence.


A large majority of Americans (70%) believe that unions mostly help the workers who are members of unions. Majorities of Americans also believe that unions help the companies where workers are unionized (55%) and the U.S. economy (52%). However, a majority (54%) of Americans believes that unions mostly hurt workers who are not members of unions.


Climate Change Polling Data

The Sanders Institute used Gallup Polling Data to delve into what the American Public thinks about global warming and climate change.

When asked about whether they are worried about climate change, a majority of Americans (64%) say they are either worried a great deal or a fair amount. A little more than a third of Americans (36%) say they are only a little or not at all worried about climate change.


However, the American public is not confident about their knowledge of climate change and global warming. Only a quarter (24%) of Americans say they understand global warming very well. Instead, just over half of Americans (55%) say they understand it “fairly well.”


This translates to a significant number of Americans who are unsure if global warming is occurring. While a solid majority (65%) of Americans believe that global warming is occurring, a quarter of Americas are unsure.


This uncertainty is in stark contrast to the consensus in the scientific community that climate change and global warming are not only occurring but that human activity is the major cause of climate change and global warming.

While just under two thirds of Americans agree with scientists that global warming is caused by human activity, three in ten (31%) of Americans believe that it is due to natural causes. This is a 32% difference in the percentage of scientists who believe that global warming is caused by human activity and the American public.


In the last 5 years, however, the number of individuals who believe that global warming has already begun has increased from just under half (49%) to almost six-in-ten (59%) Americans. This is close to highest recorded in 2008 when  61% of Americans believed that global warming had already begun.


While a majority (59%) of Americans believe that global warming is happening, around that same percentage (57%) believe that global warming will not pose a serious threat to their way of life.

However, the percentage of Americans who do not think that global warming will pose a threat to their way of live has been falling gradually since 1997 when almost seven-in-ten Americans did not think it would pose a serious threat.


Ultimately, while it is a positive thing that so many Americans believe that global warming is already happening and are worried about it, there is still a disconnect between the American people and scientists on the issue. There is room to increase familiarity with and knowledge of global warming and climate change. There is also a need to help Americans understand what effect climate change and global warming will have on their day to day activities and standard of life.