Tag: Prison

Trends In U.S. Corrections

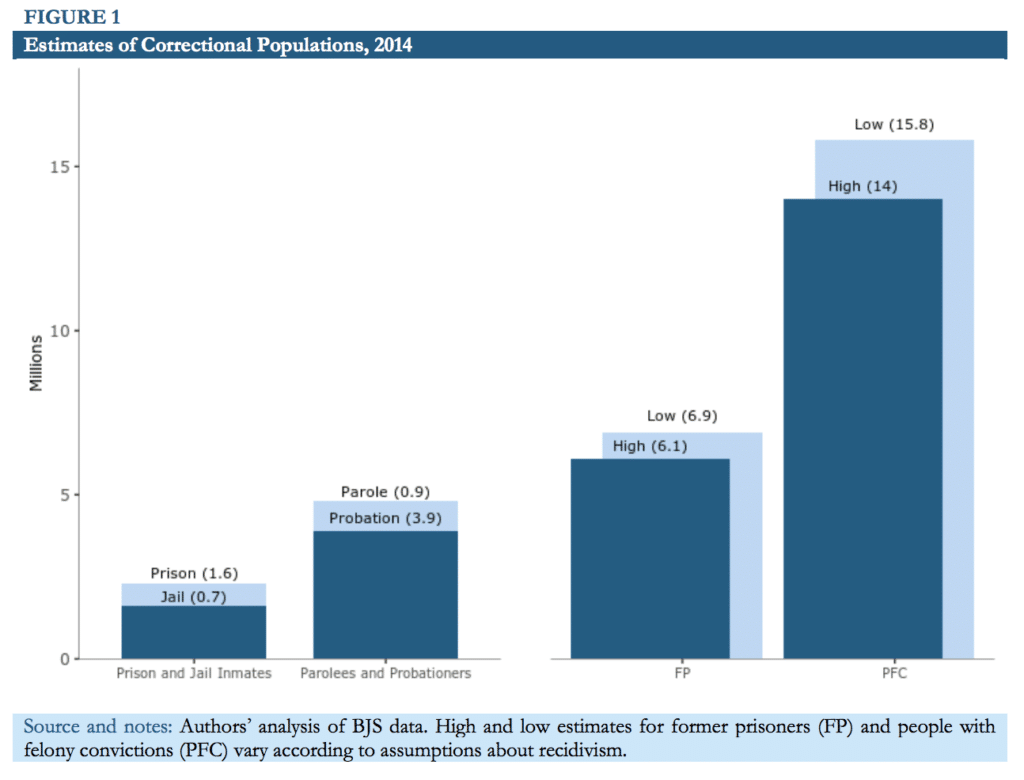
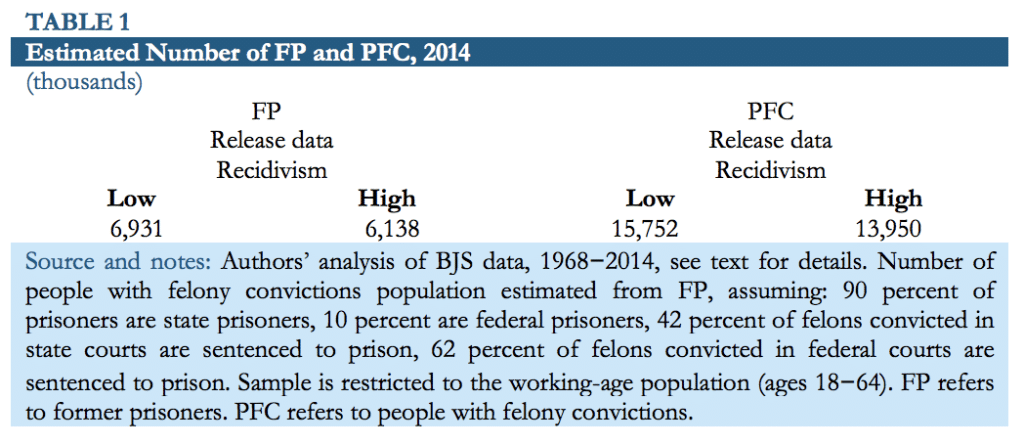
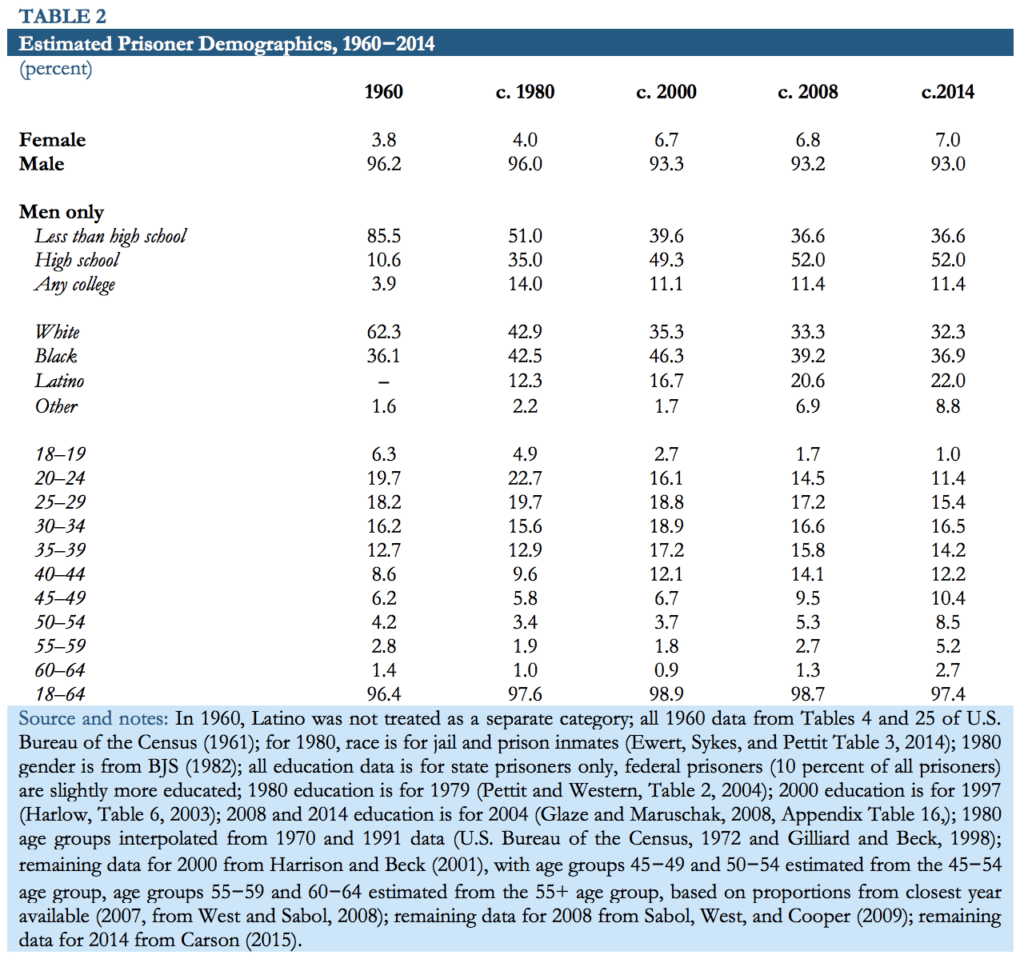
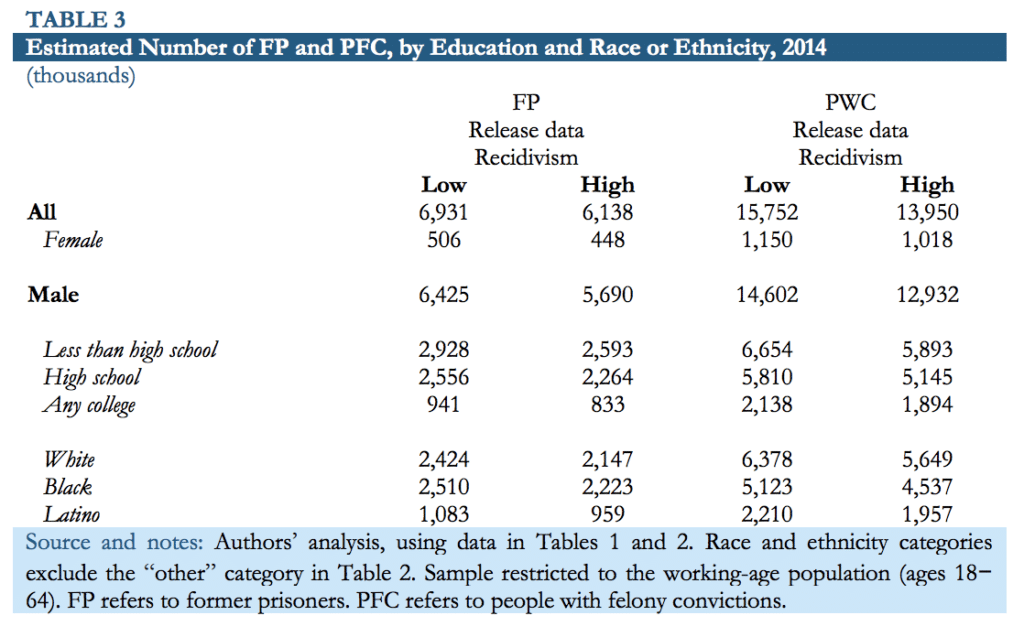
From The Sentencing Project, we present a fact sheet of Trends in U.S. Corrections, including prison populations, state and federal expenditures, the number of people in prisons and jail for various offenses, facts on women and race, as well as much more.    


Economic Costs Of Barriers To Employment For Former Prisoners And People Convicted Of Felonies

Despite modest declines in recent years, the large and decades-long blossoming of the prison population ensure that it will take many years before the United States sees a corresponding decrease in the number of former prisoners. Using data from the Bureau of Justice Statistics (BJS), this report estimates that there were between 14 and 15.8 million working-age people with felony convictions in 2014, of whom between 6.1 and 6.9 million were former prisoners.

Prior research has shown the adverse impact that time in prison or a felony conviction can have on a person’s employment prospects. In addition to the stigma attached to a criminal record, these impacts can include the erosion of basic job skills, disruption of formal education, and the loss of social networks that can improve job-finding prospects. Those with felony convictions also face legal restrictions that lock them out of many government jobs and licensed professions.

Assuming a mid-range 12 percentage-point employment penalty for this population, this report finds that there was a 0.9 to 1.0 percentage-point reduction in the overall employment rate in 2014, equivalent to the loss of 1.7 to 1.9 million workers. In terms of the cost to the economy as a whole, this suggests a loss of about $78 to $87 billion in annual GDP.

Some highlights of this study include:

  • Between 6.0 and 6.7 percent of the male working-age population were former prisoners, while between 13.6 and 15.3 percent were people with felony convictions.
  • Employment effects were larger for men than women, with a 1.6 to 1.8 percentage-point decline in the employment rate of men and a 0.12 to 0.14 decline for women.
  • Among men, those with less than a high school degree experienced much larger employment rate declines than their college-educated peers, with a drop of 7.3 to 8.2 percentage points in the employment rates of those without a high school degree and a decline of 0.4 to 0.5 percentage points for those with college experience.
  • Black men suffered a 4.7 to 5.4 percentage-point reduction in their employment rate, while the equivalent for Latino men was between 1.4 and 1.6 percentage points, and for white men it was 1.1 to 1.3 percentage points.

This paper updates earlier CEPR research that also examined the impact of former prisoners and those with felony convictions on the economy.

Introduction

The number of prisoners in the United States has grown dramatically over the past 40 years. In 1980, there were 503,600 people in prisons or jails at the federal, state and local level. By the end of 2014, this number had ballooned to 2,224,400, and an additional 4,708,100 people were on parole or probation at that time. These figures translate to about 1 in 110 adults behind bars and about 1 in 52 adults on parole or probation. Despite small decreases in the share of people in prison or jail in recent years, the United States still has one of the highest incarceration rates in the world, second only to Seychelles.

While this growth in the overall number of prisoners, parolees, and probationers has been documented over time, estimates of the total number of former prisoners and people with felony convictions have been rare. This report builds off of prior CEPR research examining the population of former prisoners and people with felony convictions. It estimates both the size (see Figure 1) and impact of this population on the U.S. labor market.

Time in prison, jail, or even a felony conviction can have a tremendous impact on the lives of former prisoners and people with felony convictions. A criminal record can negatively affect prospects for employment, education, public assistance, and even civic participation by making many people with felony convictions ineligible to vote. Often it is not just the former prisoner or person with felony convictions impacted; the well-being of their families is often threatened. This analysis focuses on the negative effect on the employment prospects of former prisoners and people with felony convictions and the implications for the labor market.

The calculations in this paper indicate that in 2014, the year for which there is the latest available data, the impediments to employment faced by former prisoners and people with felony convictions meant a loss of about 1.7 to 1.9 million workers. This was equal to a roughly 0.9 to 1.0 percentagepoint reduction in the overall employment rate, and a loss of between $78 and $87 billion in GDP.

The uptick in the U.S. incarceration rate and the number of former prisoners and people with felony convictions in the U.S. are a reflection not of a crime rate spiraling out of control, but of significant and often unnecessary changes in the criminal justice system. For example, both violent and property crime rates are much lower today than they were in the 1980s when the incarceration rate began to increase rapidly. Rather, much of the increase in incarceration is due to strict and often harsh sentencing probabilities and sentence lengths. This explosion in the number of people in U.S. prisons and jails has rightly been characterized by Gottschalk as the metastasizing carceral state.

In recent years, there has been broad acknowledgement of the need for reform of the criminal justice system, due in part to the ways in which it has directly contributed to the increase in mass incarceration and the collateral costs that have resulted. Calls to address the severity of policies such as the War on Drugs and the Violent Crime Control and Law Enforcement Act of 1994 have become louder and more critical, from the vocal protests of Black Lives Matter and others to executive orders and legislation from President Obama as well as both Democrats and Republicans in Congress. Estimates of the population of former prisoners and people with felony convictions like the one offered here can play a role in this discussion by demonstrating the negative impact of aggressive and often ineffective incarceration policies on the overall economy.


Estimating the Number of Former Prisoners and People with Felony Convictions

There are no publicly available data on the exact size or composition of the population of former prisoners and people with felony convictions. In lieu of that, this paper provides an indirect estimate of the former prisoner population, and uses it to estimate the size and composition of the population of people with felony convictions.

Table 1 displays estimates of the number of former prisoners and people with felony convictions in 2014. These estimates are based on an analysis of Bureau of Justice Statistics data that count the number of prisoners released each year from 1968 to 2014. Assuming that the age and gender distributions of released prisoners are the same as the overall prison population, this report “tracks” each yearly cohort of released prisoners over time. As it is only concerned with the working-age population (ages 18 to 64), it allows former prisoners to age out once they reach age 65. Then, agegroup-specific return-to-prison recidivism rates are applied to isolate the former prisoners who do not return to prison. Here, there is use of both a low and a high measure of the recidivism rate to account for returns that occur after three years.

Next, an estimate of age-specific death rates are applied, adjusting up accordingly, to account for the high-risk population of this study. 14 The first two columns of Table 1 imply that the former prisoner population in the U.S. in 2014 was between 6.1 million (using a high recidivism rate) and 6.9 million (using a low recidivism rate). See the Appendix for further details on this estimation technique.


In the past, researchers have attempted to estimate the former prisoner population. This paper uses the same methods of Schmitt and Warner (2010). Their report focused on the population of former prisoners and people with felony convictions in 2008, and their results showed that there were between 5.4 and 6.1 million former prisoners of working age in 2008. Forecasts made by Bonczar (2003) imply that there would be about 5.7 million former prisoners in 2008 and 6.2 million former prisoners in 2010. Extending the methods from this report back to 2010, there were approximately between 5.6 and 6.3 million former prisoners in 2010. To the best of the authors’ knowledge, there have not been any attempts to estimate the size or characteristics of the former prisoner population since 2010. However, the methods used in this paper are the same as those used by Schmitt and Warner (2010), which had results that were broadly consistent with the other estimates mentioned.

The final two columns of Table 1 show estimates of the number of people with felony convictions.

Again, there are no direct estimates of this population, but this report uses administrative data on the percent of felons sentenced to prison, in addition to the estimates of the former prisoner population presented in this paper to arrive at estimates of the number of people with felony convictions. About 44 percent of felons are sentenced to prison. The approach used in this paper estimates that there were between 14.0 million and 15.8 million people with felony convictions in 2014. In their earlier report using the same methods, Schmitt and Warner (2010) estimated that there were between 12.3 million and 13.9 million people with felony convictions in 2008.

In addition to estimates of the number of former prisoners and people with felony convictions, another goal of this paper is to determine their demographic characteristics. To estimate these characteristics, this report first uses the demographic characteristics of current prisoners for selected years and applies these estimates to the population of former prisoners and people with felony convictions. Table 2 shows various characteristics of the prisoner population for selected years from 1960 to 2014. For all years, the male prisoner population greatly outnumbered the female prisoner population, with men making up at least 93 percent of the population in all years displayed. In 2014, men made up 93.0 percent of the prison population, and this percentage has remained mostly steady since 2000.

Education level, race, and age breakdowns are also displayed for the male prison population. Male prisoners are considerably less educated than the overall male working-age population, with over 85 percent having a high school degree or less. In 2014, about 43 percent of the overall working-age male population had a high school degree or less. During the same year, 97.4 percent of male prisoners were of working age, and 31.9 percent were between the ages of 25 and 34. Also in 2014 36.9 percent of male prisoners were Black, 32.3 percent were white, and 22.0 percent were Latino.


Using the data from Table 2 on the prisoner population, estimates of the demographic characteristics of the entire population of former prisoners and people with felony convictions were created, adjusting for racial differences in recidivism rates and imprisonment rates conditional on felony conviction. Table 3 displays these estimates. According to this data, in 2014 between 448,000 and 506,000 former prisoners were women, and between 1.0 and 1.2 million people with felony convictions were women. Between 5.7 and 6.4 million former prisoners were men, and between 12.9 and 14.6 million people with felony convictions were men. Among male former prisoners, between 2.6 and 2.9 million had less than a high school degree.

There were notable differences in the racial composition of the population of male former prisoners and people with felony convictions. There were more Blacks than whites in the former prisoner population, but there were over 1 million more whites than Blacks in the population of people with felony convictions. This is the result of disparate sentencing rates between the two races. About 49 percent of Black felons are sentenced to prison, while only about 38 percent of white felons are sentenced to prison.19 In 2014, there were approximately between 2.1 and 2.4 million white male former prisoners and between 5.6 and 6.4 million white males with felony convictions. During the same year, there were between 2.2 and 2.5 million Black male former prisoners, and between 4.5 and 5.1 million Black males with felony convictions in the United States.


The Effects of Imprisonment and Felony Conviction on Subsequent Employment

A large body of evidence demonstrates that prison time and felony convictions can have a lasting and profound effect on future prospects for employment. In addition to the stigma attached to a criminal record, these impacts include the erosion of basic job skills, disruption of formal education, loss of networks that can improve job-finding prospects, or deterioration of “people skills.” Schmitt and Warner’s review of longitudinal surveys, employer surveys, audit studies, aggregated geographic data, and administrative data suggests that time behind bars can have a significant effect on the employment of those with prison experience or felony convictions. Similarly, a recent review of the literature by Travis, Western and Redbum (2014) discussed the potential supply-side effects and added that “repeated encounters with rejection may lead to cynicism and withdrawal from formal labor market activity.” And while much of the literature on the effects of incarceration focuses on men, Decker, Spohn, Ortiz and Hedberg (2014) find in their study that incarceration has a negative impact on employment for women as well. These hurdles to employment can create an unfortunate cycle as Berg and Huebner (2011) note that post–incarceration employment significantly lowers the chances of recidivism.

Assessment of Employment Effects

The employment effects of incarceration or a felony conviction vary based on the research techniques used, the population researched, and the metrics that describe the employment impact. For the most part, the research shows a moderate to large impact on the employment levels of former prisoners and people with felony convictions. However, this report is concerned with an estimate of the impact of the population of former prisoners and people with felony convictions on the employment levels of all working-age adults, which is somewhat outside the scope of much of the research on incarceration and employment. Longitudinal surveys of individuals capture much of the data necessary for the analysis in this paper and typically yield moderate to large effects on employment levels. Employer surveys and audit studies also show a large impact on employment levels but are less useful for this present analysis. Aggregate state-level data, though less-directly applicable, show small to moderate effects. Administrative studies, while more in line methodologically with longitudinal studies, have technical difficulties and produce results that are inconsistent with other available data.

To better estimate the impact on employment levels while considering these methodological differences, this paper uses the three separate estimates employed by Schmitt and Warner (2010). The estimates examine low-, medium-, and high-effects scenarios to develop estimates of the employment effects of incarceration. Like Schmitt and Warner:

“In the low-effects scenario, we assume that ex-prisoners or ex-felons pay an employment penalty of five percentage points (roughly consistent with the largest effects estimated using administrative data and the lower range of effects estimated using the aggregate data and survey data). In the mediumeffects scenario, we assume that the employment penalty faced by ex-prisoners and ex-felons is 12 percentage points, which is consistent with the bulk of the survey-based studies. In the high-effects scenario, we assume that the employment penalty is 20 percentage points, which is consistent with the largest effects estimated in the survey-based studies, as well as, arguably, the findings of the employer surveys and audit studies.”

Estimating the Impact of Former Prisoners and People with Felony Convictions on Total Employment and Output

Here, this report estimates the effect of the population of former prisoners and people with felony convictions on total employment and output. To do so, this report uses the estimates of the population of former prisoners and people with felony convictions and the outside estimates of the employment penalty faced by those with prison experience or a felony conviction from the previous two sections of this paper.

First, the size and demographic characteristics of the population of former prisoners and people with felony convictions from Table 3 are compared to the overall civilian, non-institutional workingage population. Table 4 displays estimates of the population of former prisoners and people with felony convictions as a share of the total working-age population in 2014. Overall, former prisoners were between 3.2 and 3.6 percent of the non-institutional working-age population. People with felony convictions were between 7.2 and 8.1 percent. As with those currently behind bars, former prisoners and people with felony convictions are much more likely to be men than women. In 2014, an estimated 6.0 to 6.7 percent of the working-age male population were former prisoners, and between 13.6 and 15.3 percent were people with felony convictions. On the other hand, between 0.45 and 0.51 percent of working-age women were former prisoners, and between 1.0 and 1.2 percent were people with felony convictions.

There were also notable differences by education level and race, although these estimates are less precise than those above. Between 26.6 and 30.1 percent of men with less than a high school degree were former prisoners, and between 60.5 and 68.3 percent were people with felony convictions. By contrast, only between 1.5 and 1.7 percent of men with any college experience were former prisoners and between 3.5 and 3.9 percent were people with felony convictions. Black men were more likely than their white or Latino counterparts to be former prisoners or people with felony convictions. Between 19.4 and 21.9 percent of Black men were former prisoners, and between 39.5 and 44.6 percent were people with felony convictions.


The calculations in Table 4 are then used to determine the reduction in the overall employment rate that occurs as a result of the employment penalty for former prisoners and people with felony convictions. Table 5 shows the results of this exercise for men. Three separate sets of measures are displayed. The first assumes a low, 5 percentage-point employment penalty compared to a similar worker with no prison experience or felony conviction. The second set of measures assumes a medium, 12 percentage-point employment penalty, and the last set assumes a high, 20 percentagepoint employment penalty.

Assuming a low employment penalty of 5 percentage points, the population of former prisoners and people with felony convictions lowered the employment rate of men by between 0.3 and 0.8 percentage points in 2014. Assuming a medium, 12 percentage-point employment penalty, the population of former prisoners and people with felony convictions lowered the employment rate of men by between 0.7 and 1.8 percentage points. With a high employment penalty of 20 percentage points, this population lowered the employment rate of men by between 1.2 and 3.1 percentage points.


Table 6 displays the estimated decline in overall employment rates in 2014, with various demographic breakdowns. These estimates assume a medium, 12 percentage-point employment penalty for former prisoners and people with felony convictions. They show that the population of former prisoners and people with felony convictions reduced the overall employment of the working-age population by between 0.4 and 1.0 percentage points. The impact was particularly large for Black men and men with less than a high school degree. The population of former prisoners and people with felony convictions lowered the employment rates of Black men by between 2.3 and 5.4 percentage points. This population also lowered the employment rates of men with less than a high school degree by between 3.2 and 8.2 percentage points.


The results presented in this paper show how contact with the criminal justice system in the form of a felony conviction or imprisonment can affect the future employment prospects of former prisoners and people with felony convictions. In addition to the likely large reductions in personal earnings as a result of these employment penalties, the economy as a whole suffers from a reduction in output. More specifically, this report estimates that the population of former prisoners and people with felony convictions cost the U.S. about 0.45 to 0.5 percentage points of GDP in 2014, or about $78.1 to $86.7 billion.

Conclusion

This paper examines the labor market impact of the growing number of individuals who have been imprisoned or have felony convictions. The findings presented in this paper show that, in 2014, overall employment rates were 0.9 to 1.0 percentage points lower as a result of the employment penalty faced by the large population of former prisoners and people with felony convictions. For men, their employment rate was 1.6 to 1.8 percentage points lower and for men with less than a high school degree, their employment rate was 7.3 to 8.2 percentage points lower.

However, it is not just the individual that suffers; the impact is felt across the U.S. labor market. In terms of GDP, the calculations in this report suggest that the population of former prisoners and people with felony convictions led to a loss of $78 to $87 billion in GDP in 2014. While there has recently been a push from advocates and policy-makers alike to re-examine sentencing policy and practice, the negative impacts on former prisoners and people with felony convictions themselves and the economy as a whole will grow in scale unless the burgeoning reform trend continues and accelerates.

This report has been altered for publication on The Sanders Institute website. To read the full report with the Appendix click here.

A Comprehensive Overview Of Recidivism Among Federal Offenders

This report provides a broad overview of key findings from the United States Sentencing Commission’s study of recidivism of federal offenders. The Commission studied offenders who were either released from federal prison after serving a sentence of imprisonment or placed on a term of probation in 2005. Nearly half (49.3%) of such offenders were rearrested within eight years for either a new crime or for some other violation of the condition of their probation or release conditions. This report discusses the Commission’s recidivism research project and provides many additional findings from that project. In the future, the Commission will release additional publications discussing specific topics concerning recidivism of federal offenders.

The United States Sentencing Commission began studying recidivism shortly after the enactment of the Sentencing Reform Act of 1984 (SRA). Past studies, together with ongoing multi-year research on this subject, advance the Commission’s mission to conduct research on sentencing issues related to the purposes of sentencing set forth in the SRA. Recidivism information is central to three of the primary purposes of punishment as described in the SRA – specific deterrence, incapacitation, and rehabilitation – purposes which focus on prevention of future crimes through correctional intervention. Information about recidivism also is relevant to the Commission’s obligation to formulate sentencing policy that “reflect[s], to the extent practicable, advancements in knowledge of human behavior as it relates to the sentencing process.”

Considerations of recidivism by federal offenders were central to the Commission’s initial work, as it chose to develop the Guidelines Manual’s criminal history provisions in significant part on offenders’ risk of reoffending. The Commission’s 2004 report, Measuring Recidivism, served as a “performance review” of the predictive ability of these provisions, i.e., the predictive statistical power of the criminal history measure to reflect subsequent recidivism among federal offenders. That report concluded that these provisions largely succeeded in predicting subsequent risk of reoffending. Two additional Commission reports in that same period further investigated federal offender recidivism and reviewed features of the federal sentencing guidelines. Two later publications examined recidivism by federal offenders sentenced under the guidelines for child pornography and crack cocaine.

Recent developments have refocused the Commission’s interest on the recidivism of federal offenders, particularly the recent public attention on the size of the federal prison population and the cost of incarceration. Well over 1.5 million offenders have been sentenced under the federal sentencing guidelines since their inception in 1987. In recent years, approximately 80,000 offenders have been sentenced each year for federal felonies and Class A (nonpetty) misdemeanor offenses. Nine out of ten of those federal offenders today receive sentences of imprisonment, while one out of ten is sentenced to probation. The federal prison population today is slightly under two hundred thousand inmates (which is around one-eighth of the total prison and jail population in the United States). As these numbers have grown, courts and correctional officials have sought greater information about reoffending. Recidivism information has recently been used in decisions by the Commission to reduce the periods of incarceration established for certain offenders through retroactive application of sentence reductions in the guidelines. And changes in the sentencing guidelines at the policy level have a significant effect on the imposition of individual sentences. It is in this policy climate that the Commission has begun its multi-year study of recidivism by federal offenders.

The Commission’s current recidivism research substantially expands on the scope of previous Commission recidivism projects. In addition to a different set of offenders – U.S. citizen federal offenders released in 2005 – the current study group (25,431 offenders) is much larger than those in previous Commission studies. A larger study group provides the opportunity to develop statistically useful conclusions about many subgroups of federal offenders, including those sentenced under different provisions in the guidelines. This is the first report on the results of the Commission’s study of the recidivism of the federal offenders released during this time period.

Summary of Key Findings

The key findings of the Commission’s study are:

  • Over an eight year follow-up period, almost one-half of federal offenders released in 2005 (49.3%) were rearrested for a new crime or rearrested for a violation of supervision conditions.
  • Almost one-third (31.7%) of the offenders were also reconvicted, and one-quarter (24.6%) of the offenders were reincarcerated over the same study period.
  • Offenders released from incarceration in 2005 had a rearrest rate of 52.5 percent, while offenders released directly to a probationary sentence had a rearrest rate of 35.1 percent.
  • Of those offenders who recidivated, most did so within the first two years of the eight year follow-up period. The median time to rearrest was 21 months.
  • About one-fourth of those rearrested had an assault rearrest as their most serious charge over the study period. Other common most serious offenses were drug trafficking, larceny, and public order offenses.
  • A federal offender’s criminal history was closely correlated with recidivism rates. Rearrest rates range from 30.2 percent for offenders with zero total criminal history points to 80.1 percent of offenders in the highest Criminal History Category, VI. Each additional criminal history point was generally associated with a greater likelihood of recidivism.
  • A federal offender’s age at time of release into the community was also closely associated with differences in recidivism rates. Offenders released prior to age 21 had the highest rearrest rate, 67.6 percent, while offenders over sixty years old at the time of release had a recidivism rate of 16.0 percent.
  • Other factors, including offense type and educational level, were associated with differing rates of recidivism but less so than age and criminal history

Recidivism Study Offenders

The offenders studied in this project are 25,431 federal offenders who:

  • are citizens;
  • re-entered the community during 2005 after discharging their sentence of incarceration or by commencing a term of probation in 2005;
  • have valid FBI numbers which could be located in criminal history repositories (in at least one state, the District of Columbia, or federal records);
  • are not reported dead, escaped, or detained, and
  • have a pre-sentence investigation report that was submitted to the Commission with a federal sentence that was not vacated

*The full methodology can be found here

Detailed Recidivism Findings

General Recidivism Rates: As mentioned earlier, this report uses three different measures of recidivism—rearrest, reconviction, and reincarceration.

Rearrest

Almost one-half of offenders released in 2005 (49.3%) were rearrested for a new crime or for an alleged violation of the conditions of their supervision over the eight year follow-up period. The median time to rearrest was 21 months, meaning that for one-half of the offenders rearrest occurred in less than two years following their initial release from prison or placement on probation. Among those who recidivated, the median number of rearrest events (events occurring on separate days) was two, but 21.2 percent of recidivist offenders were rearrested five times or more. When considering only the “most serious” offense committed by those who were rearrested, the most serious event that was most prevalent was assault. About one-fourth (23.3%) of those rearrested had an assault rearrest as their most serious charge over the study period. Other common “most serious” offenses were other public order (15.5%), drug trafficking (11.5%), and larceny (7.7%).


Recidivism Table 1

Reconviction

Almost one-third (31.7%) of offenders were reconvicted over the study period. Most offenders who were reconvicted were reconvicted once. The median time to reconviction, as measured from the date of the arrest that led to the reconviction, was 30 months. About one-fourth (23.9%) of those reconvicted had an assault conviction as their most serious charge over the study period. Other common most serious offenses were drug trafficking (13.5%), other public order (8.7%), and larceny (8.5%).

Reincarceration

One-quarter (24.6%) of offenders were reincarcerated over the study period. Most offenders who were reincarcerated were reincarcerated once. The median time to arrest for the offense that led to reincarceration was 29 months. More offenders (23.8%) were reincarcerated for an assault crime as their most serious offense than for any other offense. Other common most serious offenses were drug trafficking (14.5%), other public order (8.4%), and larceny (7.8%).

Comparison to State Prisoners

Compared to a cohort of state prisoners released into the community in 2005 and tracked by the Bureau of Justice Statistics, federal offenders had a lower recidivism rate. BJS found that 76.6 percent of offenders released from state prison were rearrested within five years. The Commission, using a comparable five year follow-up period and including only federal offenders released from prison (i.e., excluding those sentenced to probation or a fine only), found the recidivism rate for these federal offenders was 44.9 percent.

Using reconviction as the measure of recidivism, BJS found that 55.4 percent of state offenders had an arrest within five years that led to a conviction. The reconviction rate for federal offenders over the same length of time was 26.0 percent. When recidivism is measured by reincarceration, BJS found a 28.2 recidivism rate for state offenders within five years that led to an incarceration, compared to 20.7 percent of the federal offenders in the Commission’s study.

Time to First Recidivism Event

The measure of the time to first recidivism event can be useful in distinguishing offenders who recidivate early from those who eventually recidivate, but are apparently crime-free for a longer interval. Tracking the length of time to failure can also help policymakers determine an appropriate period of supervision after the release from prison, for example by extending supervision through the peak crime-prone interval. Time from release to first arrest is shown for all rearrests, reconvictions, and reincarcerations.

During the first year following release into the community, 16.6 percent of the offenders in the Commission’s study were rearrested for the first time. Each subsequent year fewer people were rearrested for the first time than in the previous year, going out to year seven. For example, 10.5 percent of the total were rearrested in the second year, and 6.6 percent of the total were rearrested in the third year. An additional 1.8 percent of offenders who were not previously arrested were rearrested in the eighth year, as demonstrated below.


Recidivism Table 2


Recidivism Figure 4


Most Serious Recidivism Offense

The Commission ranked new offenses in order of seriousness for those who reoffended. When considering only the “most serious” post-release offense committed by those who were rearrested, assault was the most prevalent. About one-fourth (23.3%) of those rearrested had an assault rearrest as their most serious post-release event over the study period. Other common “most serious” offenses were public order (15.5%), drug trafficking (11.5%), and larceny (7.7%).


Recidivism Figure 5


Recidivism and Criminal History

The relationship between prior criminal record and recidivism has been recognized by the Commission since its inception in the mid-1980s, as discussed in Chapter Four of the Guidelines Manual. Empirical research assessing correlates of recidivism and criminal career behavior was consulted in formulating the criminal history scoring system and recent research confirms this relationship. The previously referenced Commission study, Measuring Recidivism (2004), confirmed that Chapter Four’s criminal history provisions were working as designed, and recidivism rates rise as criminal history points increase and as Criminal History Categories increase. The present analysis confirms that these criminal history provisions continue to work as designed.

An offender’s total criminal history points, which determines the CHC to which the offender is assigned for the purpose of calculating the sentencing range under the guidelines, is designed in part to reflect recidivism potential. In order “to protect the public from further crimes of the particular defendant, the likelihood of recidivism and future criminal behavior must be considered.” Fully consistent with its previous recidivism studies, the Commission’s present study found that recidivism rates are most closely correlated with total criminal history points. For example, 30.2 percent of offenders with zero total criminal history points were rearrested within eight years, compared to 81.5 percent of offenders with more than 10 total criminal history points. In fact, each additional criminal history point is generally associated with a greater likelihood of recidivism. For example, the rearrest rate of offenders with three total criminal history points is 52.7 percent, compared to 59.4 percent for four point offenders. This pattern continues even at higher total points, with rearrest rates ranging from 71.1 percent (seven point offenders), 74.0 percent (eight point offenders), and 76.1 percent (nine point offenders).


Recidivism Figure 6


Because an offender’s criminal history score determines the CHC to which he or she is assigned, recidivism rates are also correlated with the CHC. That is, the higher the CHC (a result of more prior crimes and/or more serious crimes), the higher the recidivism rate. Rearrest rates ranged from a low of 33.8 percent for those in CHC I to a high of 80.1 percent for those in CHC VI.

Other guideline provisions that account for an offender’s prior crimes also serve as good predictors of future recidivism. For example, offenders designated under the guidelines as career offenders47 and armed career criminals48 receive substantially increased sentences because they are repeat offenders with serious criminal backgrounds. These offenders have substantially higher recidivism rates than other offenders in the study group. In fact, those two groups of offenders have the highest recidivism rates of any group in this report. Taken together, these offenders had a rearrest rate of 69.5 percent, compared to a rearrest rate of 48.7 percent for all other offenders.


Recidivism Figure 7A


Recidivism Figure 7B


The Commission did not find a strong correlation between the severity of the offender’s federal offense conduct, as determined under the sentencing guidelines, and future recidivism. Under the guidelines, the seriousness of an offender’s federal crime is measured by a final offense level score ranging from one to 43. There is not a strong correspondence between final offense level and recidivism. For example, offenders whose federal offense was assigned to the lowest final offense levels (one through eight) had a rearrest rate of 45.2 percent, almost the same rearrest rate as those assigned the highest final offense levels of 31 through 43 (45.7%). It should be noted, however, that the offense levels in the federal sentencing guidelines were intended to reflect multiple purposes of punishment, including just punishment and general deterrence (which are unrelated to offender recidivism).

Although the specific numerical offense severity determined under the sentencing guidelines appears to not be correlated with recidivism, the type of crime the offender committed does have some correlation with the risk of future crime. Offenders whose federal offense involved firearms were most likely to be rearrested (68.3%), followed by those arrested for robbery (67.3%), immigration (55.7%), drug trafficking (49.9%), larceny (44.4%), other (42.0%), and fraud (34.2%).

Offenders who received an enhanced sentence for a weapon, either through a conviction under 18 U.S.C. § 924(c) or by application of a specific offense characteristic in the guidelines for having a weapon present during commission of a crime, had higher recidivism rates than other offenders. Offenders with such a weapon enhancement had a rearrest rate of 55.4 percent, compared to 48.6 percent for all other offenders.


Recidivism Figure 8


Offenders who were organizers, leaders, managers, or supervisors of an offense received an aggravating role adjustment of 2, 3, or 4 levels under the guidelines, increasing their total offense level. Those with such an aggravating role adjustment were less likely to recidivate than other offenders. Those receiving no adjustment (93.6 percent of all offenders in the study) had a rearrest rate of 50.2 percent. However, those receiving aggravating role adjustments had recidivism rates of: 37.3 percent (two level increase); 35.6 percent (three level increase); and 33.7 percent (four level increase).

Offenders who were found to have a minor or minimal role in an offense received a mitigating role adjustment of 2, 3, or 4 levels under the guidelines, decreasing their total offense level. Offenders in the study with such a mitigating role adjustment (10.6% of all offenders) were somewhat less likely to recidivate than other offenders. Those receiving no adjustment had a rearrest rate of 49.7 percent. However, those receiving mitigating role adjustments had recidivism rates of: 47.2 percent (two level decrease); 37.5 percent (three level decrease); and 43.6 percent (four level decrease).

An offender who demonstrates acceptance of responsibility for his offense can receive a reduction in offense level of 2 or 3 levels. The vast majority of all offenders in the Commission’s study (90.7%) received a reduction in their guideline range for acceptance of responsibility. Such an adjustment was not associated with lower recidivism rates. Offenders with no adjustment under §3E1.1 had a rearrest rate of 46.3 percent. Offenders who received a two-level decrease had a rearrest rate of 46.6 percent, and those with a three level decrease were higher still (50.9%).


Recidivism Figure 9


Recidivism and Sentences Imposed

Recidivism rates differ according to the type of sentence imposed. As previously noted, 81.2 percent of the study group were sentenced to some amount of imprisonment. These offenders had the highest rate of rearrest, 52.5 percent. Conversely, offenders sentenced to probationary sentences (18.8 percent of the study group) had a rearrest rate of 35.1 percent.

Offenders with shorter lengths of imprisonment generally had lower recidivism rates. For instance, offenders with sentences of imprisonment of fewer than six months had the lowest rearrest rate at 37.5 percent, followed by offenders with sentences from six to 11 months (50.8 percent), and 12 to fewer than 24 months (50.8%). Conversely, the highest recidivism rates are generally found among offenders with longer sentences. Those with sentences from 60 months to fewer than 120 months had the highest rate (55.5%), followed closely by those with 24 to fewer than 60 months (54.0%), and 120 months or more (51.8%).

The correlation between sentence type and length and recidivism is not, of course, entirely a coincidence. The guidelines are intended, in part, to incapacitate offenders whose criminal records indicate a greater risk of future criminality. Those with prison sentences are incapacitated in a manner that those receiving no term of incarceration are not, and those receiving longer terms of incarceration as a result of their higher CHCs are also at greater risk of recidivism than those receiving no incarceration or a shorter period of incarceration who generally had lower CHCs.

The most common length of supervised release imposed for those offenders who received terms of supervised release to follow their terms of imprisonment was 36 months. Offenders ordered to serve a term of supervised release of three years were the majority of offenders, and this group had the highest rearrest rate, 55.4 percent. The lowest rearrest rate was found among offenders serving a term of supervised release of ten years or more (42.7%), and the second lowest rate occurred with offenders serving two year terms (46.8%).


Recidivism Figure 10


Recidivism and Offender Characteristics

Studies have repeatedly shown that older offenders at sentencing are at lower risk for reoffending, and the Commission’s research confirms these findings.56 Offenders sentenced when younger than twenty-one had a 71.1 percent rearrest rate, compared to 14.0 percent of offenders who are sentenced after age sixty.

Age at release also is associated with different rates of recidivism. Those released into the community who were below age twenty-one had the highest rearrest rate, 67.6 percent. Conversely, those oldest at age of release, over sixty years old, had the lowest recidivism rate, 16.0 percent. For each age grouping shown below, the older the age group, the lower the rearrest rate. The same pattern holds for reconviction and reincarceration.


Recidivism Figure 11


Male offenders (52.2%) were rearrested at higher rates than females (36.4%).

Eight years after release into the community, Black offenders had been arrested at the highest rates (59.1%), followed by Other Race (49.4%), Hispanic (49.1%), and White (41.7%) offenders. However, the apparent relationship between race/ethnicity and recidivism is much less pronounced if the prior criminal history of these offenders is also examined. For offenders assigned to higher CHCs, recidivism results are similar, regardless of race or ethnicity. Rearrest rates for White, Black, and Hispanic offenders in CHC IV are 69.7 percent, 77.6 percent, and 75.4 percent, respectively. At CHC V for the same three groups, the rearrest rates are 75.6, 78.5, and 79.9 percent, respectively. At CHC VI for the same three groups, the rearrest rates are 77.1, 82.4, and 79.3 percent, respectively. Much of the difference in overall recidivism rates appears to be the result of the differing proportion of Black offenders in CHC I (38.9%), compared to White offenders (59.7%) and Hispanic offenders (62.2%).

Education levels are also associated with different rates of recidivism. Offenders with less than a high school diploma had the highest recidivism rates (60.4%), followed by high school graduates (50.7%) and those with some college (39.3%). College graduates had the lowest rates (19.1%).


Recidivism Figure 12


Conclusion

The study of recidivism by federal offenders directly relates to multiple statutory purposes of punishment as set forth in the Sentencing Reform Act of 1984. Using automated criminal history data, the Commission tracked 25,431 federal offenders who either discharged a federal prison sentence or commenced a term of probation in 2005 during an eight-year follow-up period. The Commission found that almost one-half of these federal offenders who reentered the community in 2005 (49.3%) were rearrested for a new crime or rearrested for a violation of supervision conditions during the follow-up period.

The Commission found that, consistent with existing research, two factors – offenders’ criminal histories and their ages at the time of release into the community – were most closely associated with differences in recidivism rates. Younger offenders recidivated at significantly higher rates than older offenders, and offenders with more extensive criminal histories recidivated at significantly higher rates than offenders with lesser criminal histories. Regarding criminal history in particular, the Commission found that an offenders’ total criminal history points, as determined under Chapter Four of the Commission’s Guidelines Manual, were closely correlated with recidivism rates.

Other factors, including educational achievement and offense type, also were associated with differences in recidivism rates, but less so than age and criminal history. Certain factors related to provisions in Chapters Two and Three of the Guidelines Manual – including adjustments in an offender’s offense level as well as the total offense level – were not associated with differences in rates of recidivism. However, unlike Chapter Four’s provisions – which were based in large part on recidivism data – the guideline’s offense level computations are based on several purposes of punishment, some of which are unrelated to recidivism, including general deterrence and retributivist concerns.

This report has been modified for publication on The Sanders Institute website. To read the full article click here.

Criminal Justice Facts

The United States is the world’s leader in incarceration. There are 2.2 million people in the nation’s prisons and jails—a 500% increase over the last 40 years. Changes in law and policy, not changes in crime rates, explain most of this increase. The results are overcrowding in prisons and fiscal burdens on states, despite increasing evidence that large-scale incarceration is not an effective means of achieving public safety.


Figure 1 Criminal Justice


Figure 2 Criminal Justice


How did this happen?

We started sending more people to prison.

A series of law enforcement and sentencing policy changes of the “tough on crime” era resulted in dramatic growth in incarceration. Since the official beginning of the War on Drugs in 1982, the number of people incarcerated for drug offenses in the U.S. skyrocketed from 41,000 in 1980 to nearly half a million in 2014. Today, there are more people behind bars for a drug offense than the number of people who were in prison or jail for any crime in 1980. The number of people sentenced to prison for property and violent crimes has also increased even during periods when crime rates have declined.


Figure 3 Criminal Justice


We started sending people to prison for much longer terms.

Harsh sentencing laws like mandatory minimums, combined with cutbacks in parole release, keep people in prison for longer periods of time. The National Research Council reported that half of the 222% growth in the state prison population between 1980 and 2010 was due to an increase of time served in prison for all offenses. There has also been a historic rise in the use of life sentences: one in nine people in prison is now serving a life sentence, nearly a third of whom are sentenced to life without parole.


Figure 4 Criminal Justice


Mass incarceration has not touched all communities equally

Sentencing policies, implicit racial bias, and socioeconomic inequity contribute to racial disparities at every level of the criminal justice system. Today, people of color make up 37% of the U.S. population but 67% of the prison population. Overall, African Americans are more likely than white Americans to be arrested; once arrested, they are more likely to be convicted; and once convicted, they are more likely to face stiff sentences. Black men are six times as likely to be incarcerated as white men and Hispanic men are more than twice as likely to be incarcerated as non-Hispanic white men.


Figure 5 Criminal Justice


Mass incarceration and public safety

Crime rates have declined substantially since the early 1990s, but studies suggest that rising imprisonment has not played a major role in this trend. The National Research Council concluded that while prison growth was a factor in reducing crime, “the magnitude of the crime reduction remains highly uncertain and the evidence suggests it was unlikely to have been large.” Several factors explain why this impact was relatively modest.

First, incarceration is particularly ineffective at reducing certain kinds of crimes: in particular, youth crimes, many of which are committed in groups, and drug crimes. When people get locked up for these offenses, they are easily replaced on the streets by others seeking an income or struggling with addiction.

Second, people tend to “age out” of crime. Research shows that crime starts to peak in the mid- to late- teenage years and begins to decline when individuals are in their mid-20s. After that, crime drops sharply as adults reach their 30s and 40s. The National Research Council study concludes:

“Because recidivism rates decline markedly with age, lengthy prison sentences, unless they specifically target very high-rate or extremely dangerous offenders, are an inefficient approach to preventing crime by incapacitation.”

As a result, the excessive sentencing practices in the U.S. are largely counterproductive and extremely costly.


Figure 6 Criminal Justice


Significant reforms in recent years

After nearly 40 years of continued growth, the U.S. prison population has stabilized in recent years.

This is partially a result of declining crime rates, but has largely been achieved through pragmatic changes in policy and practice. For more than a decade, the political climate of criminal justice reform has been evolving toward evidence-based, commonsense approaches to public safety. This can be seen in a variety of legislative, judicial, and policy changes that have successfully decreased incarceration without adverse impacts on public safety.

At the state level:

  • California voters passed ballot measure Proposition 47 in 2014, which reclassified certain low-level property and drug crimes from felonies to misdemeanors, and will reinvest some of the fiscal savings into prevention programs
  • New York policymakers reformed the Rockefeller drug laws in 2009, which imposed harsh mandatory minimum sentences for low-level drug offenses

At the federal level:

  • In 2014, the United States Sentencing Commission unanimously voted to reduce excessive sentences for up to 46,000 people currently serving time for federal drug offenses
  • Congress passed the Fair Sentencing Act in 2010, which reduced the disparity in sentencing between crack and powder cocaine offenses
    As promising as these changes may be, we are a long way from solving our national problem of mass incarceration—and the way forward is clear.

Where do we need to go from here?

Just as a bicycle works best when it uses different gears based on the terrain, we need a justice system that has different responses for different situations—shifting gears to treatment, prevention, and long-term public safety solutions as appropriate. By taking a practical approach to criminal justice reform, we can decrease crime, enhance public safety, and make more responsible use of our resources.

In particular, we need to start by:

    • Eliminating mandatory minimum sentences and cutting back on excessively lengthy sentences; for example, by imposing a 20-year maximum on prison terms.
    • Shifting resources to community-based prevention and treatment for substance abuse.
    • Investing in interventions to that promote strong youth development and respond to delinquency in age-appropriate and evidence-based ways.
    • Examining and addressing the policies and practices, conscious or not, that contribute to racial inequity at every stage of the justice system.
    • Removing barriers that make it harder for individuals with criminal records to turn their lives around.