Tag: Healthcare

Meet The New Boss, Same As The Old Boss

The announcement by the CEO’s from JP Morgan Chase, Amazon and Berkshire-Hathaway that they are forming a new healthcare company signals the symbolic end of the ACA-reform era. They recognize the inefficiencies and profiteering of the private insurance companies, who add no value to businesses dealing with healthcare. And should there be any doubt that the end of the ACA is nigh, there’s this from Trump: “We repealed the core of disastrous Obamacare. The individual mandate is now gone.”

Given the record of the CEO-in-chief who now occupies the White House, it’s doubtful we can expect improved healthcare, or lower costs, under his leadership, which should give us pause before putting CEOs in charge of our health.

If the ACA had fulfilled its promises, a new company by these CEOs would not be needed. The ACA sought to lower costs by forcing consumers to put more “skin in the game,” in Obama’s Budget Director Peter Orzag’s infamous phrase. Yes, patients are spending more, and in 2017 insurance premiums went up over 25% in many areas, deductibles have continued to climb to an average of $1440 for employees in large groups, and drug prices have skyrocketed for long-standing medications like Insulin and newer specialty drugs like Harvoni for Hepatitis C. High-deductible plans and a steady shift so workers pay more for insurance (on average 30% of premiums that are $18,000/year) has not lowered overall costs. Even worse, patients who have paid high premiums are not able to get care because they cannot afford the out-of-pockets costs their expensive insurance does not cover.

Into the breach come the heroic CEOs Bezos, Dimond and Buffett (BDB*). What do they offer? A company that can control costs. How will they do it? With technology, of course. Apparently we have come full circle: since the government regulatory program couldn’t enact effective cost control and utilize technology to save money, let’s have a corporation do so. But it is precisely the industry model that has created our dysfunctional, “money is the metric” approach to health. In the present healthcare industry, the war for revenue between insurers, drug companies, and hospital corporations, along with medical equipment manufacturers and other suppliers, has raised prices and created immense profits. Electronic Medical Records, and other technological innovations are supposed to anchor the new healthcare system. They are expensive, in fact more expensive than any savings they generate. The result of the ACA push to pay for “performance” has been to punish clinicians and hospitals with high-needs patients, no lowering of costs, and increased denials of care since there is an incentive to avoid rather than treat patients who will lower your “performance” score.

Somebody or some entity is going to make the decisions regarding the healthcare we get. Do we really believe CEO’s rather than clinicians should make those decisions? If the decisions are based on corporate bottom lines we can expect continued cost shifts to workers, deployment of labor-displacing technologies with unproven impacts on patient care quality, and fragmentation as each corporate castle fortifies its strategic market position: Aetna-CVS will go toe-toe-toe with BDB* as the Ascension hospital corporation (nation’s largest) pushes back, for example. Since less care equals greater profits, and more covered lives means greater revenue, we can see that money will likely remain the metric.

Those who control capital, like the richest guy in the world, investment banks and investors, favor capital-intensive approaches to social problems. Technology fits that bill. Yet, technology only serves the purposes for which it is designed: it is neither socially neutral nor a panacea. Nurses know, however, that human health cannot be reduced to an algorithm, subject as it is to the particularities of an individual’s family history, environment and most fundamentally, socio-economic status. Let’s hope the technologists and CEOs quickly learn from direct care RNs. Standardization of treatments whether through algorithms, protocols, or budget-mandates do not match the needs of individual patients.

Alternatively, the US could expand and improve the current program that puts clinicians in charge, is popular, and works at controlling costs: Medicare. With administrative costs as low as 5–6% compared to the 13% or higher for private insurance, Medicare is more efficient. The growth in Medicare spending, around 2.4% annually, is much less than growth in overall healthcare spending and far less than recent premium increases. Under Improved Medicare for All, benefits would be expanded to include those that ACA, Medicaid and CHIP provide, and Medicare will negotiate prescription drug prices. The biggest shortfalls in Medicare, the escalating privatization pushed by the insurance-financed politicians that have resulted in higher out of pocket costs for seniors, over payments to the private Medicare Advantage plans and the “donut hole” in the private the prescription drug benefit, would be eliminated through a robust Medicare for all plan, such as proposed nationally in Sen. Bernie Sanders S 1804 bill or the California single payer bill SB 562.

Moreover, traditional Medicare enables physicians to deliver the care their patients need without onerous “gate-keeping,” prior authorizations or narrow networks that insurers use to restrict access, limit choice of providers and undermine the clinical judgment of doctors and nurses. In fact, since older Americans tend to be the most intensive users of health services, expanding the pool by including everybody especially low-needs patients will make the program more sustainable.

Should patients, workers and employers be on the hook for the excessive compensation and enormous profits of the health insurance industry? In California between 2011–16, insurers made $27 billion in profits/net income. Why should we subsidize the failed business model of health insurers? (Employers get $342 billion each year in tax subsidies to lessen the cost to them of private health insurance.)

On this BDB is right—health insurance companies add no value, and the profits in healthcare are obscene. That recognition matters and can point the way toward real reform. The solution is not more of the same. We must contain prices in order to control costs. An industry approach cannot do that and also place patient care at the center of a reformed system.
Nina Turner Contributes To What’s At Stake: Healthcare For All

Free Speech TV (FSTV) and Manhattan Neighborhood Network (MNN) co-hosted a “health care for all” town hall, led by veteran journalist Laura Flanders and produced by Globalvision. “What’s at Stake? Health Care for All” features a panel of experts who discuss single payer health care options. Featured panelists include:

Joshua Holland, Contributing Writer, The Nation
Nina Turner, President, Our Revolution, Founding Fellow, The Sanders Institute
Donna Smith, Executive Director, Progressive Democrats of America


Medicaid, Explained: Why It’s Worse To Be Sick In Some States Than Others

This video from Vox looks at the Medicaid system through the eyes of an individual on Medicaid, Matthew, who has Crohn’s Disease. He is one of the 1 in 5 Americans who get their healthcare paid for by Medicaid.

The video states “The thing about Matthew is, if he lived in a different state, he might not have Medicaid.” It explains the history of healthcare in the United States, the attempts of certain presidents (FDR, Truman, and LBJ) to create a national healthcare system, the reason behind the emergence of a private healthcare market, and the ultimate expansion of Medicaid under the Affordable Care Act.

Due to the Supreme Court decision that made this expansion voluntary by state, the video explains that the specific states get to decide who gets covered and what service gets covered. Some individuals are consistently covered across the board, like children and Pregnant women; However, coverage of other groups like individual who make below a certain amount per year are only covered in certain states.

The video goes on to describe the rising costs of Medicaid, due to the rising costs of health care in the United States, and ways that Republicans have proposed to change Medicaid.


Next Steps For CHIP: What Is At Stake For Children?

The Children’s Health Insurance Program (CHIP) is an important complement to Medicaid, covering 8.9 million children with family incomes above Medicaid eligibility limits who often lack access to affordable private coverage.1 

Together with Medicaid, which covers an additional 37.1 million children,2 the programs provide a strong base of coverage for our nation’s low-income children. New legislative authority is needed to continue funding for CHIP beyond September 2017. Failure to extend CHIP funding would likely result in coverage losses for children and increased financial pressure for states. These effects would be compounded if combined with the changes in the American Health Care Act (AHCA), which would fundamentally restructure Medicaid by capping federal funding and eliminate longstanding federal protections and standards for children. Following are key facts that highlight what is at stake for children.


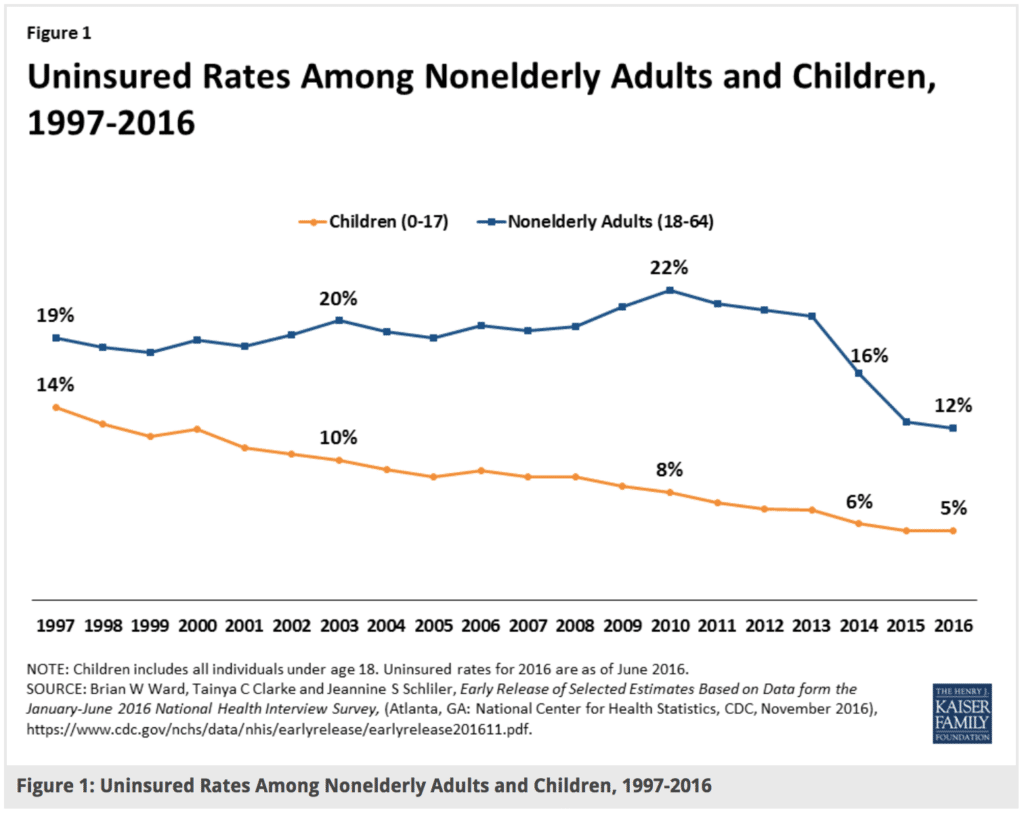
Expansions of Medicaid and CHIP have helped reduce the children’s uninsured rate to a record low of 5% (Figure 1).


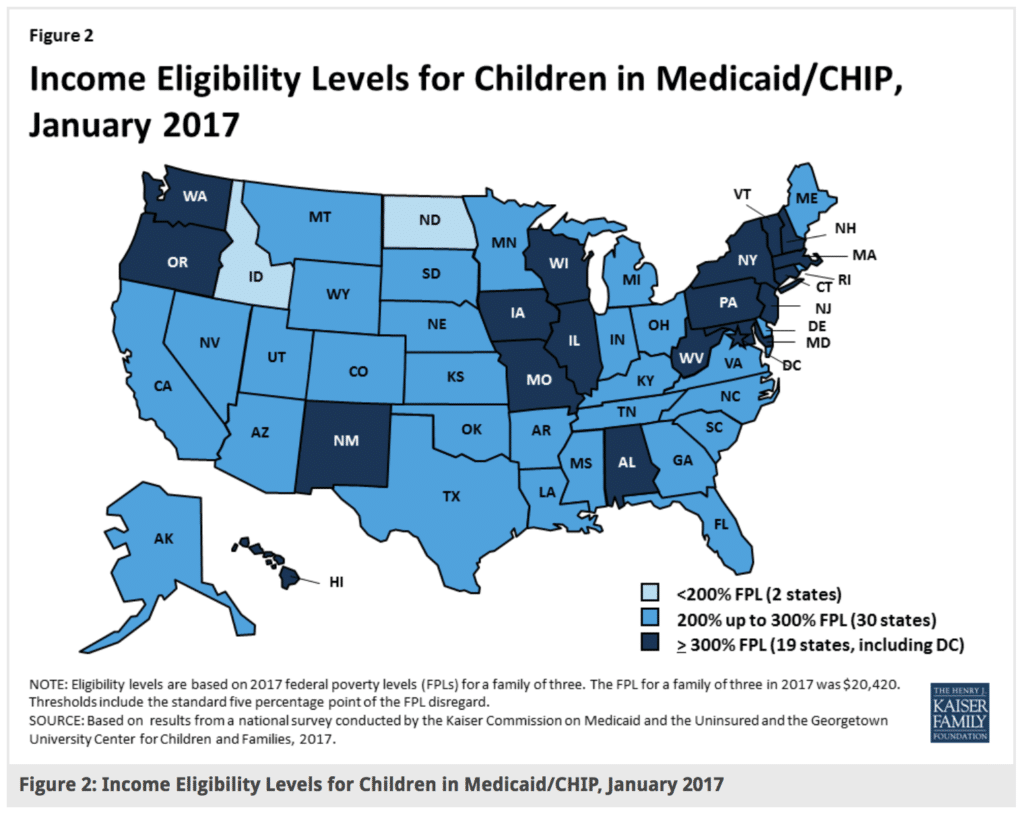
All states have expanded eligibility for children through Medicaid and CHIP above federal minimum levels (Figure 2).


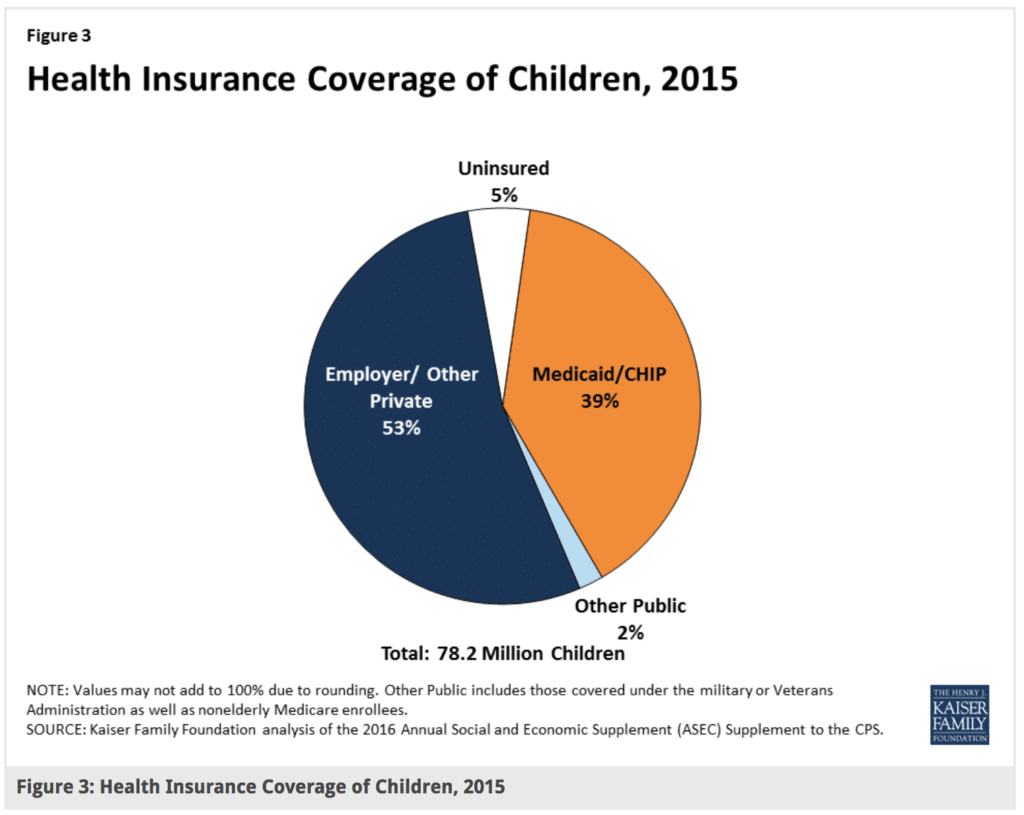
Medicaid and CHIP are major sources of coverage for our nation’s children (Figure 3).


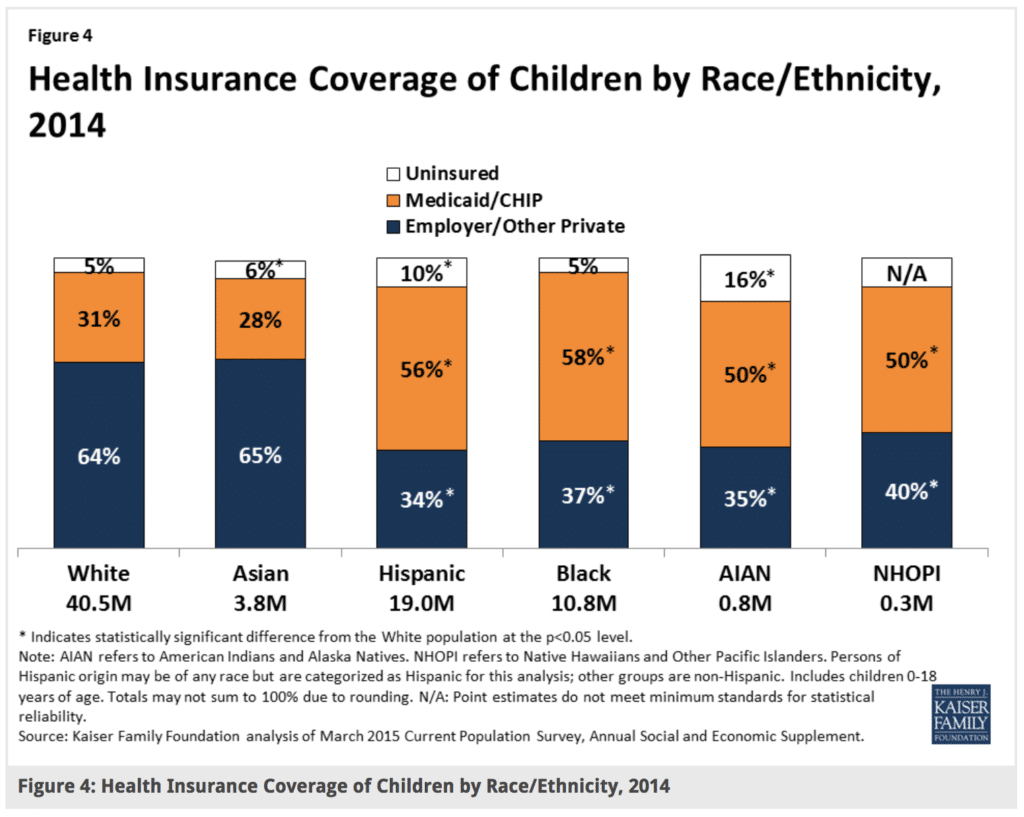
Medicaid and CHIP cover over half of children of color (Figure 4).


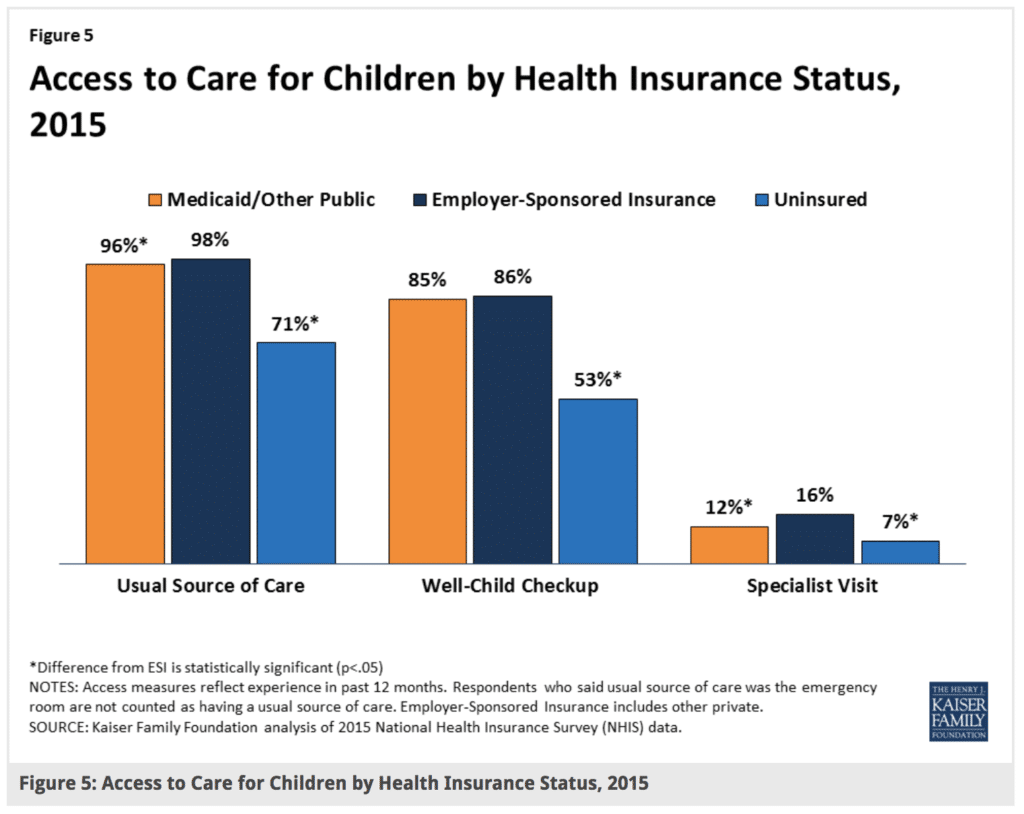
Medicaid and CHIP provide children access to needed care (Figure 5).


Endnotes

1. Centers for Medicare and Medicaid Services (CMS), FFY 2016 Number of Children Ever Enrolled in Medicaid and CHIP, (Baltimore, MD: CMS, February 2017.

2. Ibid

H.R. 1628, American Health Care Act Of 2017: Summary Of Cost Estimate

CBO and the staff of the Joint Committee on Taxation (JCT) have completed an estimate of the direct spending and revenue effects of H.R. 1628, the American Health Care Act of 2017, as passed by the House of Representatives.

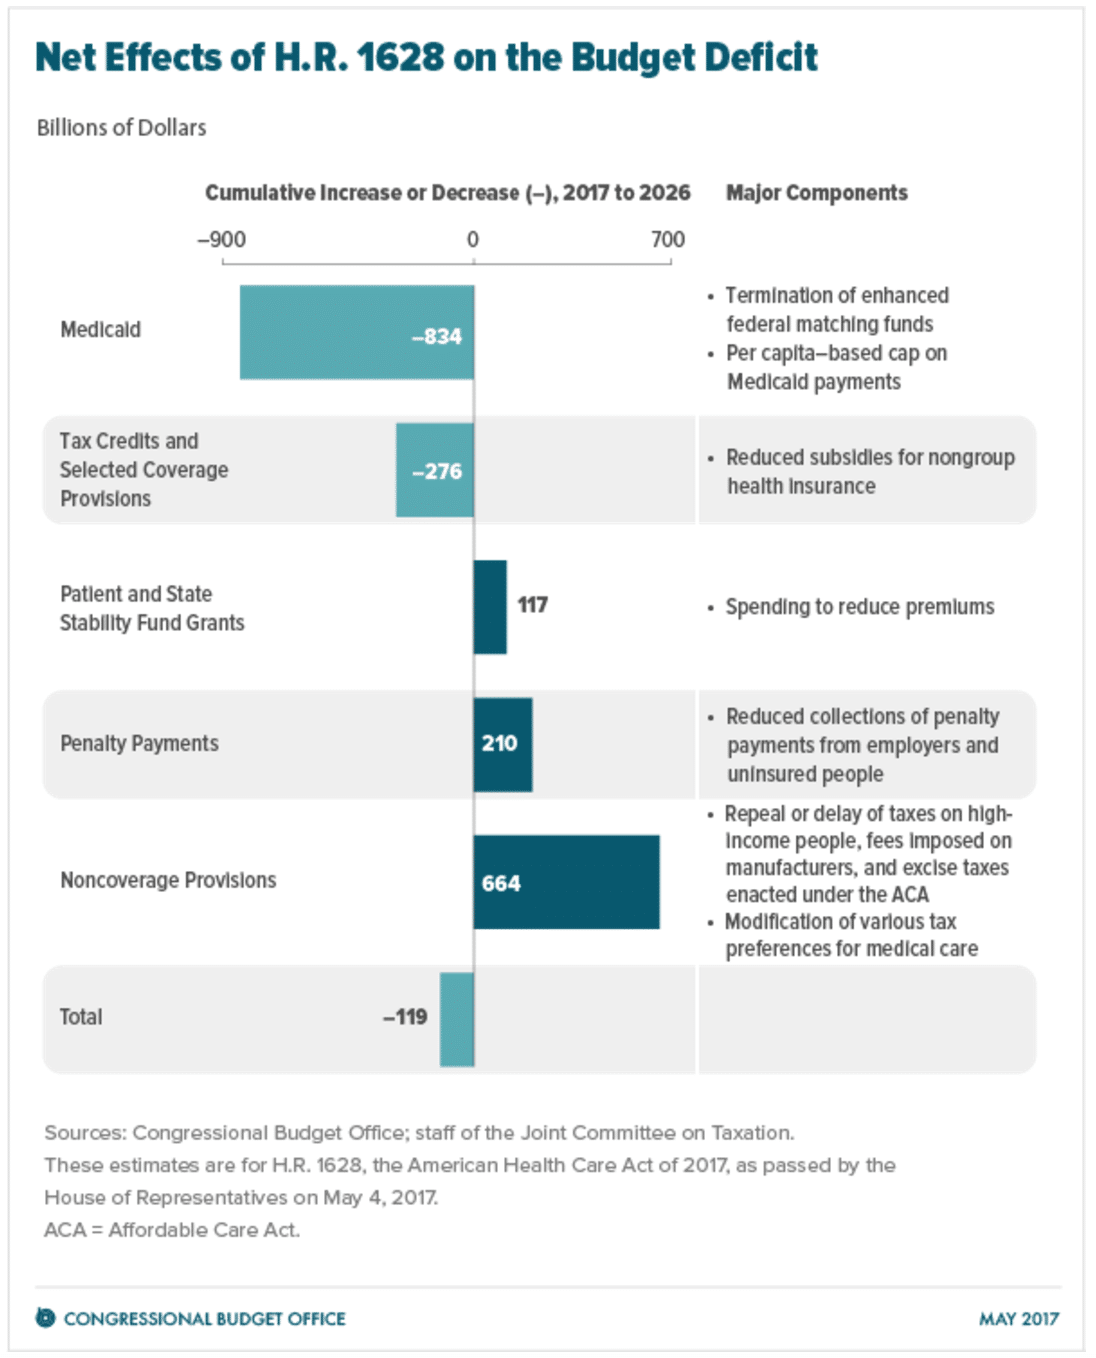
CBO and JCT estimate that enacting that version of H.R. 1628 would reduce the cumulative federal deficit over the 2017-2026 period by $119 billion. That amount is $32 billion less than the estimated net savings for the version of H.R. 1628 that was posted on the website of the House Committee on Rules on March 22, 2017, incorporating manager’s amendments 4, 5, 24, and 25. (CBO issued a cost estimate for that earlier version of the legislation on March 23, 2017.)

In comparison with the estimates for the previous version of the act, under the House-passed act, the number of people with health insurance would, by CBO and JCT’s estimates, be slightly higher and average premiums for insurance purchased individually—that is, nongroup insurance—would be lower, in part because the insurance, on average, would pay for a smaller proportion of health care costs. In addition, the agencies expect that some people would use the tax credits authorized by the act to purchase policies that would not cover major medical risks and that are not counted as insurance in this cost estimate.

Effects on the Federal Budget

CBO and JCT estimate that, over the 2017-2026 period, enacting H.R. 1628 would reduce direct spending by $1,111 billion and reduce revenues by $992 billion, for a net reduction of $119 billion in the deficit over that period. The provisions dealing with health insurance coverage would reduce the deficit, on net, by $783 billion; the noncoverage provisions would increase the deficit by $664 billion, mostly by reducing revenues.

The largest savings would come from reductions in outlays for Medicaid and from the replacement of the Affordable Care Act’s (ACA’s) subsidies for nongroup health insurance with new tax credits for nongroup health insurance (see figure below). Those savings would be partially offset by other changes in coverage provisions—spending for a new Patient and State Stability Fund, designed to reduce premiums, and a reduction in revenues from repealing penalties on employers who do not offer insurance and on people who do not purchase insurance. The largest increases in the deficit would come from repealing or modifying tax provisions in the ACA that are not directly related to health insurance coverage—such as repealing a surtax on net investment income, repealing annual fees imposed on health insurers, and reducing the income threshold for determining the tax deduction for medical expenses.


Pay-as-you-go procedures apply because enacting H.R. 1628 would affect direct spending and revenues. CBO and JCT estimate that enacting H.R. 1628 would not increase net direct spending or on-budget deficits in any of the four consecutive 10-year periods beginning in 2027. CBO has not completed an estimate of the potential impact of the legislation on discretionary spending, which would be subject to future appropriation action.

Effects on Health Insurance Coverage

CBO and JCT broadly define private health insurance coverage as consisting of a comprehensive major medical policy that, at a minimum, covers high-cost medical events and various services, including those provided by physicians and hospitals. The agencies ground their coverage estimates on that widely accepted definition, which encompasses most private health insurance plans currently offered in the group and nongroup markets. The definition excludes policies with limited insurance benefits (known as mini-med plans); “dread disease” policies that cover only specific diseases; supplemental plans that pay for medical expenses that another policy does not cover; fixed-dollar indemnity plans that pay a certain amount per day for illness or hospitalization; and single-service plans, such as dental-only or vision-only policies. In this estimate, people who have only such policies are described as uninsured because they do not have financial protection from major medical risks.

CBO and JCT estimate that, in 2018, 14 million more people would be uninsured under H.R. 1628 than under current law. The increase in the number of uninsured people relative to the number projected under current law would reach 19 million in 2020 and 23 million in 2026. In 2026, an estimated 51 million people under age 65 would be uninsured, compared with 28 million who would lack insurance that year under current law. Under the legislation, a few million of those people would use tax credits to purchase policies that would not cover major medical risks.

Stability of the Health Insurance Market

Decisions about offering and purchasing health insurance depend on the stability of the health insurance market—that is, on the proportion of people living in areas with participating insurers and on the likelihood of premiums’ not rising in an unsustainable spiral. The market for insurance purchased individually with premiums not based on one’s health status—that is, nongroup coverage without medical underwriting—would be unstable if, for example, the people who wanted to buy coverage at any offered price would have average health care expenditures so high that offering the insurance would be unprofitable.

Under Current Law. Although premiums have been rising under current law, most subsidized enrollees purchasing health insurance coverage in the nongroup market are largely insulated from increases in premiums because their out-of-pocket payments for premiums are based on a percentage of their income; the government pays the difference between that percentage and the premiums for a reference plan. The subsidies to purchase coverage, combined with the effects of the individual mandate, which requires most individuals to obtain insurance or pay a penalty, are anticipated to cause sufficient demand for insurance by enough people, including people with low health care expenditures, for the market to be stable in most areas.

Nevertheless, some areas of the country have limited participation by insurers in the nongroup market under current law. Several factors could lead insurers to withdraw from the market—including lack of profitability and substantial uncertainty about enforcement of the individual mandate and about future payments of the cost-sharing subsidies to reduce out-of-pocket payments for people who enroll in nongroup coverage through the marketplaces established by the ACA.

Under the Legislation. CBO and JCT anticipate that, under H.R. 1628, nongroup insurance markets would continue to be stable in many parts of the country. Although substantial uncertainty about how the new law would be implemented could lead insurers to withdraw from or not enter the nongroup market, several factors would bring about market stability in most states before 2020. In the agencies’ view, those key factors include subsidies to purchase insurance, which would maintain sufficient demand for insurance by people with low health care expenditures, and grants to states from the Patient and State Stability Fund, which would lower premiums by reducing the costs to insurers of people with high health care expenditures.

The agencies expect that the nongroup market in many areas of the country would continue to be stable in 2020 and later years as well, including in some states that obtain waivers from market regulations. Even though the new tax credits, which would take effect in 2020, would be structured differently from the current subsidies and would generally be less generous for those receiving subsidies under current law, other changes (including the money available through the Patient and State Stability Fund) would, in the agencies’ view, lower average premiums enough to attract a sufficient number of relatively healthy people to stabilize the market.

However, the agencies estimate that about one-sixth of the population resides in areas in which the nongroup market would start to become unstable beginning in 2020. That instability would result from market responses to decisions by some states to waive two provisions of federal law, as would be permitted under H.R. 1628. One type of waiver would allow states to modify the requirements governing essential health benefits (EHBs), which set minimum standards for the benefits that insurance in the nongroup and small-group markets must cover. A second type of waiver would allow insurers to set premiums on the basis of an individual’s health status if the person had not demonstrated continuous coverage; that is, the waiver would eliminate the requirement for what is termed community rating for premiums charged to such people. CBO and JCT anticipate that most healthy people applying for insurance in the nongroup market in those states would be able to choose between premiums based on their own expected health care costs (medically underwritten premiums) and premiums based on the average health care costs for people who share the same age and smoking status and who reside in the same geographic area (community-rated premiums). By choosing the former, people who are healthier than average would be able to purchase nongroup insurance with relatively low premiums.

CBO and JCT expect that, as a consequence, the waivers in those states would have another effect: Community-rated premiums would rise over time, and people who are less healthy (including those with preexisting or newly acquired medical conditions) would ultimately be unable to purchase comprehensive nongroup health insurance at premiums comparable to those under current law, if they could purchase it at all—despite the additional funding that would be available under H.R. 1628 to help reduce premiums. As a result, the nongroup markets in those states would become unstable for people with higher-than-average expected health care costs. That instability would cause some people who would have been insured in the nongroup market under current law to be uninsured. Others would obtain coverage through a family member’s employer or through their own employer.

Effects on Premiums and Out-of-Pocket Payments

CBO and JCT projected premiums for single policyholders under H.R. 1628 (before any tax credits were applied) and compared those with the premiums projected under current law for policies purchased in the nongroup market. H.R. 1628, as passed by the House, would tend to increase such premiums before 2020, relative to those under current law—by an average of about 20 percent in 2018 and 5 percent in 2019, as the funding provided by the act to reduce premiums had a larger effect on pricing.

Starting in 2020, however, average premiums would depend in part on any waivers granted to states and on how those waivers were implemented and in part on what share of the funding available from the Patient and State Stability Fund was applied to premium reduction. To facilitate the analysis, CBO and JCT examined three general approaches states could take to implement H.R. 1628. Because a projection of a specific state’s actions would be highly uncertain, the agencies’ estimates reflect an assessment of the probabilities of different outcomes, without any explicit predictions about which states would make which decisions. CBO and JCT estimate the following:

  • About half the population resides in states that would not request waivers regarding the EHBs or community rating, CBO and JCT project. In those states, average premiums in the nongroup market would be about 4 percent lower in 2026 than under current law, mostly because a younger and healthier population would be purchasing the insurance. The changes in premiums would vary for people of different ages. A change in the rules governing how much more insurers can charge older people than younger people, effective in 2019, would directly alter the premiums faced by different age groups, substantially reducing premiums for young adults and raising premiums for older people.
  • About one-third of the population resides in states that would make moderate changes to market regulations. In those states, CBO and JCT expect that, overall, average premiums in the nongroup market would be roughly 20 percent lower in 2026 than under current law, primarily because, on average, insurance policies would provide fewer benefits. Although the changes to regulations affecting community rating would be limited, the extent of the changes in the EHBs would vary widely; the estimated reductions in average premiums range from 10 percent to 30 percent in different areas of the country. The reductions for younger people would be substantially larger and those for older people substantially smaller.
  • Finally, about one-sixth of the population resides in states that would obtain waivers involving both the EHBs and community rating and that would allow premiums to be set on the basis of an individual’s health status in a substantial portion of the nongroup market, CBO and JCT anticipate. As in other states, average premiums would be lower than under current law because a younger and healthier population would be purchasing the insurance and because large changes to the EHB requirements would cause plans to a cover a smaller percentage of expected health care costs. In addition, premiums would vary significantly according to health status and the types of benefits provided, and less healthy people would face extremely high premiums, despite the additional funding that would be available under H.R. 1628 to help reduce premiums. Over time, it would become more difficult for less healthy people (including people with preexisting medical conditions) in those states to purchase insurance because their premiums would continue to increase rapidly. As a result of the narrower scope of covered benefits and the difficulty less healthy people would face purchasing insurance, average premiums for people who did purchase insurance would generally be lower than in other states—but the variation around that average would be very large. CBO and JCT do not have an estimate of how much lower those premiums would be.

Although premiums would decline, on average, in states that chose to narrow the scope of EHBs, some people enrolled in nongroup insurance would experience substantial increases in what they would spend on health care. People living in states modifying the EHBs who used services or benefits no longer included in the EHBs would experience substantial increases in out-of-pocket spending on health care or would choose to forgo the services. Services or benefits likely to be excluded from the EHBs in some states include maternity care, mental health and substance abuse benefits, rehabilitative and habilitative services, and pediatric dental benefits. In particular, out-of-pocket spending on maternity care and mental health and substance abuse services could increase by thousands of dollars in a given year for the nongroup enrollees who would use those services. Moreover, the ACA’s ban on annual and lifetime limits on covered benefits would no longer apply to health benefits not defined as essential in a state. As a result, for some benefits that might be removed from a state’s definition of EHBs but that might not be excluded from insurance coverage altogether, some enrollees could see large increases in out-of-pocket spending because annual or lifetime limits would be allowed. That could happen, for example, to some people who use expensive prescription drugs. Out-of-pocket payments for people who have relatively high health care spending would increase most in the states that obtained waivers from the requirements for both the EHBs and community rating.

Uncertainty Surrounding the Estimates

The ways in which federal agencies, states, insurers, employers, individuals, doctors, hospitals, and other affected parties would respond to the changes made by the legislation are all difficult to predict, so the estimates discussed in this document are uncertain. In particular, states would have a wide range of options—notably, the optional waivers discussed above that would allow them to modify the minimum set of benefits that must be provided by insurance sold in the nongroup and small-group markets and that would permit medical underwriting for people who did not demonstrate continuous coverage. The array of market regulations that states could implement makes estimating the outcomes especially uncertain. But, throughout, CBO and JCT have endeavored to develop estimates that are in the middle of the distribution of potential outcomes.

Macroeconomic Effects

Because of the magnitude of its budgetary effects, this legislation is “major legislation,” as defined in the rules of the House of Representatives. Hence, it triggers the requirement that the cost estimate, to the greatest extent practicable, include the budgetary impact of its macroeconomic effects. However, because of the limited time available to prepare this cost estimate, quantifying and incorporating those macroeconomic effects have not been practicable.

Intergovernmental and Private-Sector Mandates

JCT and CBO have determined that H.R. 1628, as passed by the House, would impose no intergovernmental mandates as defined in the Unfunded Mandates Reform Act (UMRA). JCT and CBO have determined that the legislation would impose private-sector mandates as defined in UMRA. On the basis of information from JCT, CBO estimates the aggregate cost of the mandates would exceed the annual threshold established in UMRA for private-sector mandates ($156 million in 2017, adjusted annually for inflation).

How Affordable Care Act Repeal And Replace Plans Might Shift Health Insurance Tax Credits

An important part of the repeal and replacement discussions around the Affordable Care Act (ACA) will involve the type and amount of subsidies that people get to help them afford health insurance.  This is particularly important for lower and moderate income individuals who do not have access to coverage at work and must purchase coverage directly.

The ACA provides three types of financial assistance to help people afford health coverage: Medicaid expansion for those with incomes below 138% of poverty (the Supreme Court later ruled this to be at state option); refundable premium tax credits for people with incomes from 100% to 400% of the poverty level who purchase coverage through federal or state marketplaces; cost-sharing subsidies for people with incomes from 100% to 250% of poverty to provide lower deductibles and copays when purchasing silver plans in a marketplace.

This analysis focuses on alternative ways to provide premium assistance for people purchasing individual market coverage, explaining how they work, providing examples of how they’re calculated, and presenting estimates of how assistance overall would change for current ACA marketplace enrollees.  Issues relating to changing Medicaid or methods of subsidizing cost-sharing will be addressed in other analyses.

Premium Tax Credits Under the ACA and Current Replacement Proposals

The ACA and leading replacement proposals rely on refundable tax credits to help individual market enrollees pay for premiums, although the credit amounts are set quite differently.  The House Leadership proposal released on March 6, the American Health Care Act, proposes refundable tax credits which vary with age (with a phase-out for high-income enrollees) and grow annually with inflation.  The tax credits under the ACA vary with family income and the cost of insurance where people live, as well as age, and grow annually if premiums increase.

These various tax credit approaches can have quite different implications for different groups of individual market purchasers.  For example, the tax credits under the ACA are higher for people with lower incomes than for people with higher incomes, and no credit is provided for individuals with incomes over 400% of poverty.  The current replacement proposal, in contrast, is flat for incomes up to $75,000 for an individual and $150,000 for a married couple, and so would provide relatively more assistance to people with upper-middle incomes.  Similarly, the ACA tax credits are relatively higher in areas with higher premiums (like many rural areas), while the replacement proposal credits do not vary by location.  If premiums grow more rapidly than inflation over time (which they generally have), the replacement proposal tax credits will grow more slowly than those provided under the ACA.

The next section describes the differing tax credit approaches in more detail and draws out some of the implications for different types of purchasers.

How the Different Tax Credits Are Calculated

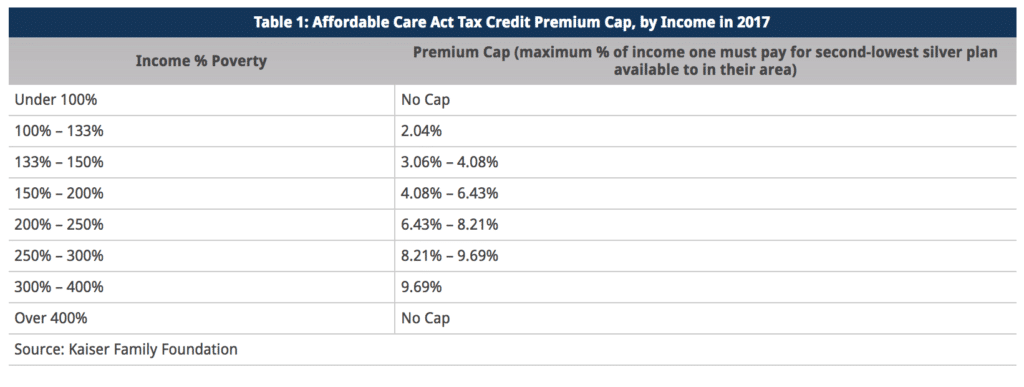
The ACA provides tax credits for individuals with family incomes from 100% to 400% of poverty ($11,880 to $47,520 for a single individual in 2017) if they are not eligible for employer-provided or public coverage and if they purchase individual market coverage in the federal or a state marketplace.  The tax credit amounts are calculated based on the family income of eligible individuals and the cost of coverage in the area where the live. More specifically, the ACA tax credit for an eligible individual is the difference between a specified percentage of his or her income (Table 1) and the premium of the second-lowest-cost silver plan (referred to as the benchmark premium) available in the area in which they live.  There is no tax credit available if the benchmark premium is less than the specified percentage of premium (which can occur for younger purchasers with relatively higher incomes) or if family income falls outside of the 100% to 400% of poverty range.  For families, the premiums for family members are added together (including up to 3 children) and compared to specified income percentages. ACA tax credits are made available in advance, based on income information provided to the marketplace, and reconciled based on actual income when a person files income taxes the following.


Take, for example, a person age 40 with income of $30,000, which is 253% of poverty.  At this income, the person’s specified percentage of income is 8.28% in 2017, which means that the person receives a tax credit if he or she has to pay more than 8.28% of income (or $2,485 annually) for the second-lowest-cost silver premium where he or she lives.  If we assume a premium of $4,328 (the national average benchmark premium for a person age 40 in 2017), the person’s tax credit would be the difference between the benchmark premium and the specified percentage of income, or $4,328 – $2,485 = $1,843 (or $154 per month).


The American Health Care Act takes a simpler approach and specifies the actual dollar amounts for a new refundable tax credit that could be used to purchase individual market coverage.  The amounts vary only with age up until an income of $75,000 for a single individual, at which point they begin to phase out. Tax credits range from $2,000 for people under age 30, to $2,500 for people ages 30 to 39, $3,000 for people age 40 to 49, $3,500 for people age 50 to 59, and $4,000 for people age 60 and over starting in 2020. Eligibility for the tax credit phases out starting at income above $75,000 for single individuals (the credit is reduced, but not below zero, by 10 cents for every dollar of income above this threshold, reaching zero at an income of $95,000 for single individuals up to age 29 or $115,000 for individuals age 60 and older). For joint filers, credits begin to phase out at an income of $150,000 (the tax credit is reduced to zero at an income of $190,000 for couples up to age 29; it is reduced to zero at income $230,000 for couples age 60 or older; and it is reduced to zero at income of $290,000 for couples claiming the maximum family credit amount). People who sign up for public programs such as Medicare, Medicaid, public employee health benefit programs, would not be eligible for a tax credit. The proposal further limits eligibility for tax credits to people who do not have an offer available for employer-provided health benefits.

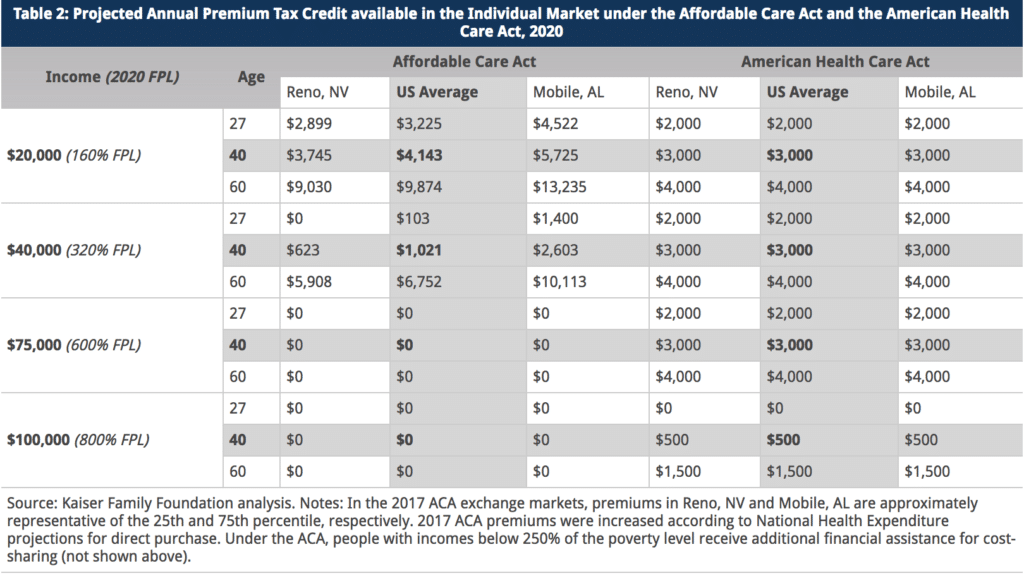
Table 2 shows how projected ACA tax credits in 2020 compare to what would be provided under the American Health Care Act for people at various incomes, ages, and geographic areas. To show the ACA amounts in 2020, we inflated all 2017 premiums based on projections for direct purchase spending per enrollee from the National Health Expenditure Accounts. This method applies the same premium growth across all ages and geographic locations.  Note that the table does not include cost-sharing assistance under the ACA that lowers deductibles and copayments for low-income marketplace enrollees. For example, in 2016, people making between 100 – 150% of poverty enrolled in a silver plan on healthcare.gov received cost-sharing assistance worth $1,440; those with incomes between 150 – 200% of poverty received $1,068 on average; and those with incomes between 200 – 250% of poverty received $144 on average.


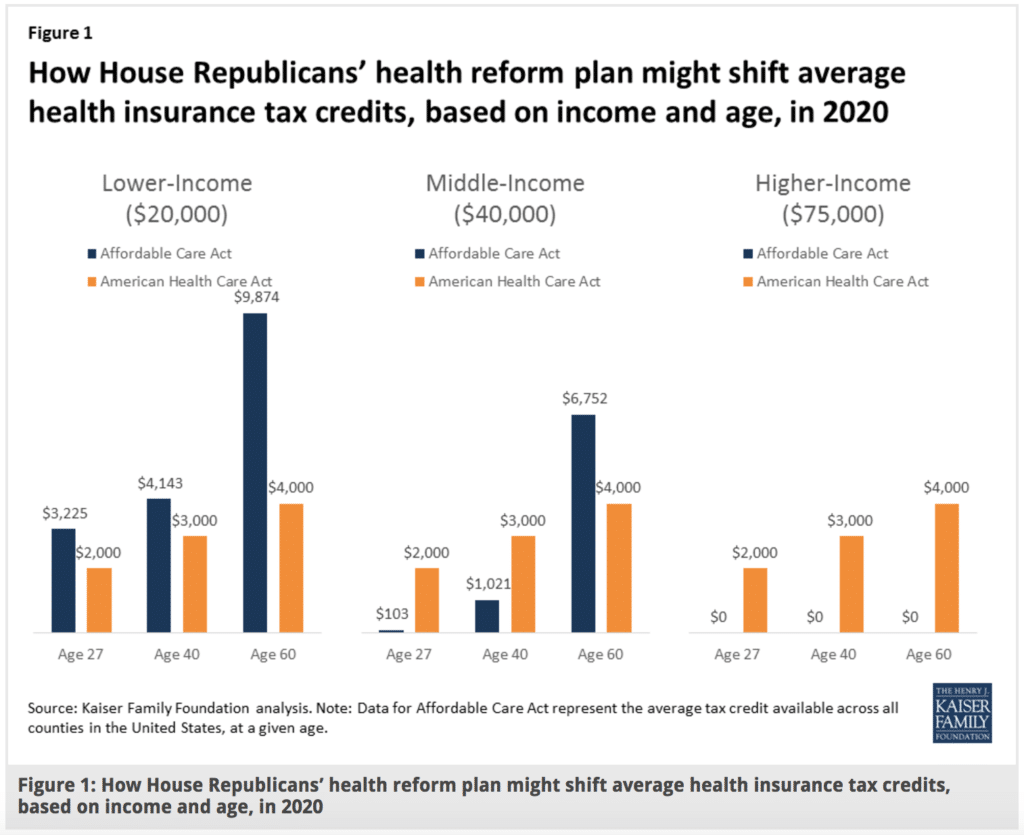
Under the ACA in 2020, we project that a typical 40-year-old making $20,000 per year would be eligible for $4,143 in premium tax credits (not including the additional cost-sharing subsidies to lower his or her deductibles and copayments), while under the American Health Care Act, this person would be eligible $3,000. For context, we project that the average ACA premium for a 40-year-old in 2020 would be $5,101 annually (meaning the tax credit in the ACA would cover 81% of the total premium) for a benchmark silver plan with comprehensive benefits and reduced cost-sharing. A $3,000 tax credit for this same individual under the American Health Care Act would represent 59% of the average 40-year-old benchmark silver premium under the ACA

Generally, the ACA has higher tax credit amounts than the replacement plan for lower-income people – especially for those who are older and live in higher-cost areas – and lower credits for those with higher incomes. Unlike the ACA, the replacement plan provides tax credits to people over 400% percent of the poverty level (phasing out around 900% of poverty for a single person), as well as to people current buying individual market coverage outside of the marketplaces (not included in this analysis).

While replacement plan tax credits vary by age – by a factor of 2 to 1 for older adults relative to younger ones – the variation is substantially less than under the ACA. The big differences in ACA tax credits at different ages is due to the fact that premiums for older adults can be three times the level of premiums for younger adults under the ACA, but all people at a given income level are expected to pay the same percentage of their income towards a benchmark plan. The tax credit fills in the difference, and this amount is much higher for older adults. These differences by age would be even further magnified under the American Health Care Act (which permits premiums to vary by a factor of 5 to 1 due to age). Before the ACA, premiums for older adults were typically four or five times the premiums charged to younger adults.


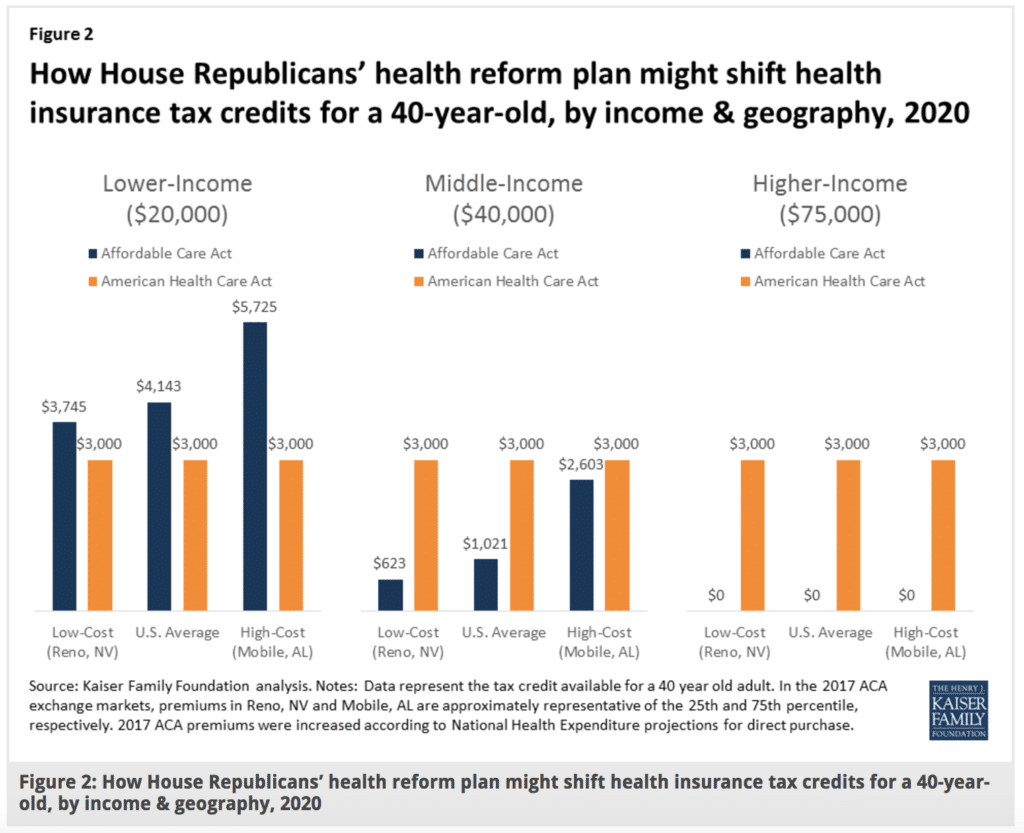
The tax credits in the ACA vary significantly with premium costs in an area (see Table 2 and Figure 2). At a given income level and age, people receive bigger tax credits in a higher premium area like Mobile, Alabama and smaller tax credits in a lower premium area like Reno, Nevada. Under the ACA in 2017, premiums in Mobile, Alabama and Reno, Nevada approximately represent the 75th and 25th percentile, respectively.

The disparities between the ACA tax credits and those in the American Health Care Act will therefore vary noticeably across the country.


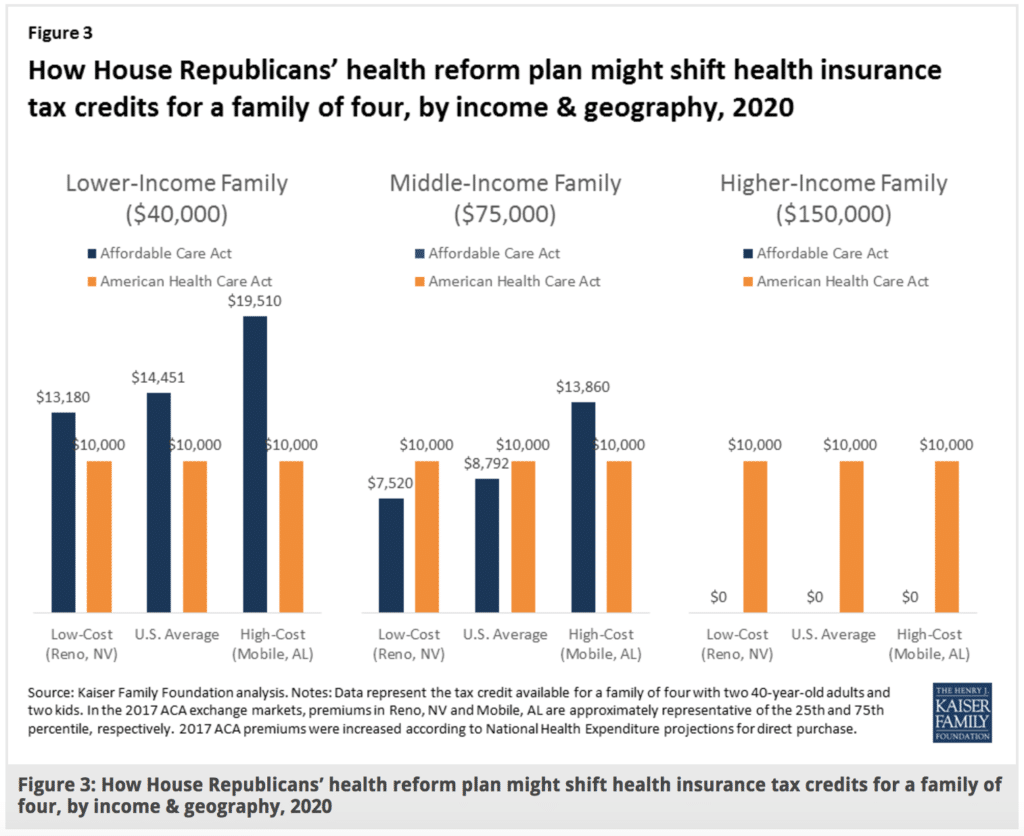
The same general pattern can be seen for families as individuals, with lower-income families – and particularly lower-income families in higher-cost areas – receiving larger tax credits under the ACA, while middle-income families in lower-cost areas would receive larger tax credits under the American Health Care Act (Figure 3).


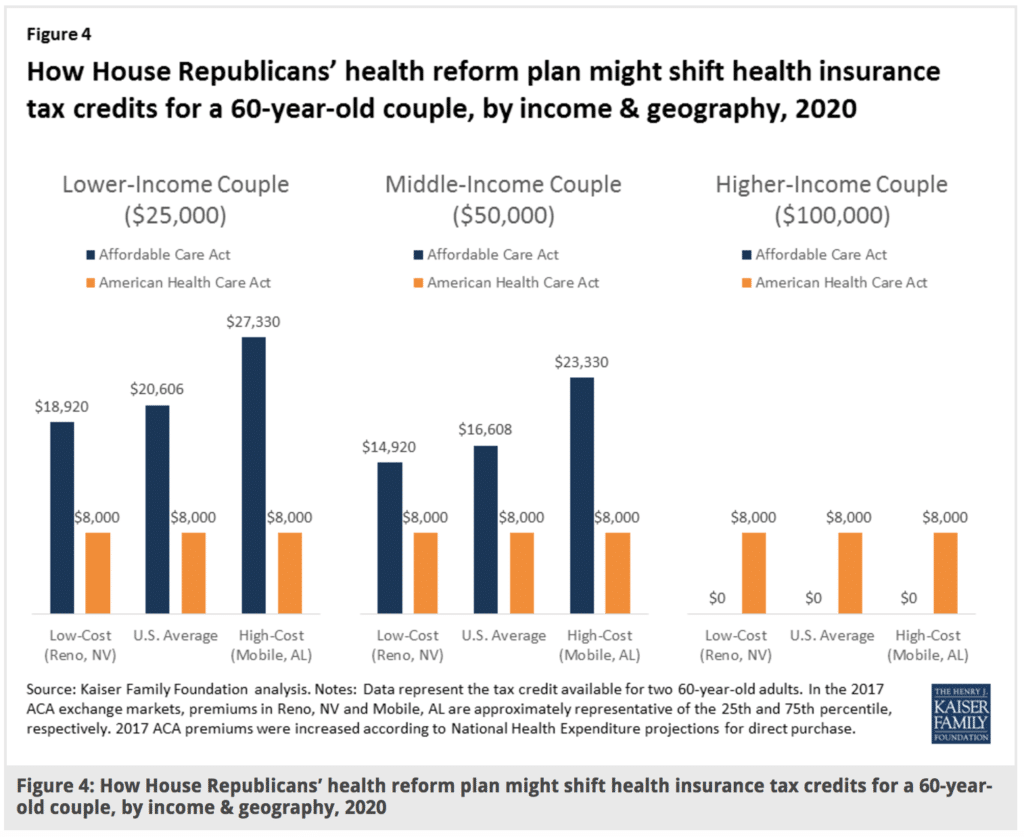
Figure 4 below shows how tax credits under the ACA differ from those in the American Health Care Act for a couple in their 60’s with no children. In this scenario, because premiums for older adults are higher and the ACA ties tax credits to the cost of premiums, a 60-year-old couple would receive larger tax credits under the ACA than the American Health Care Act at lower and middle incomes, but would receive a larger tax credit under the American Health Care Act at higher incomes.


Estimates of Tax Credits Under the ACA and the American Health Care Act Over Time

We estimated the average tax credits that current ACA marketplace enrollees are receiving under the ACA and what they would qualify for if the American Health Care Act were in place.


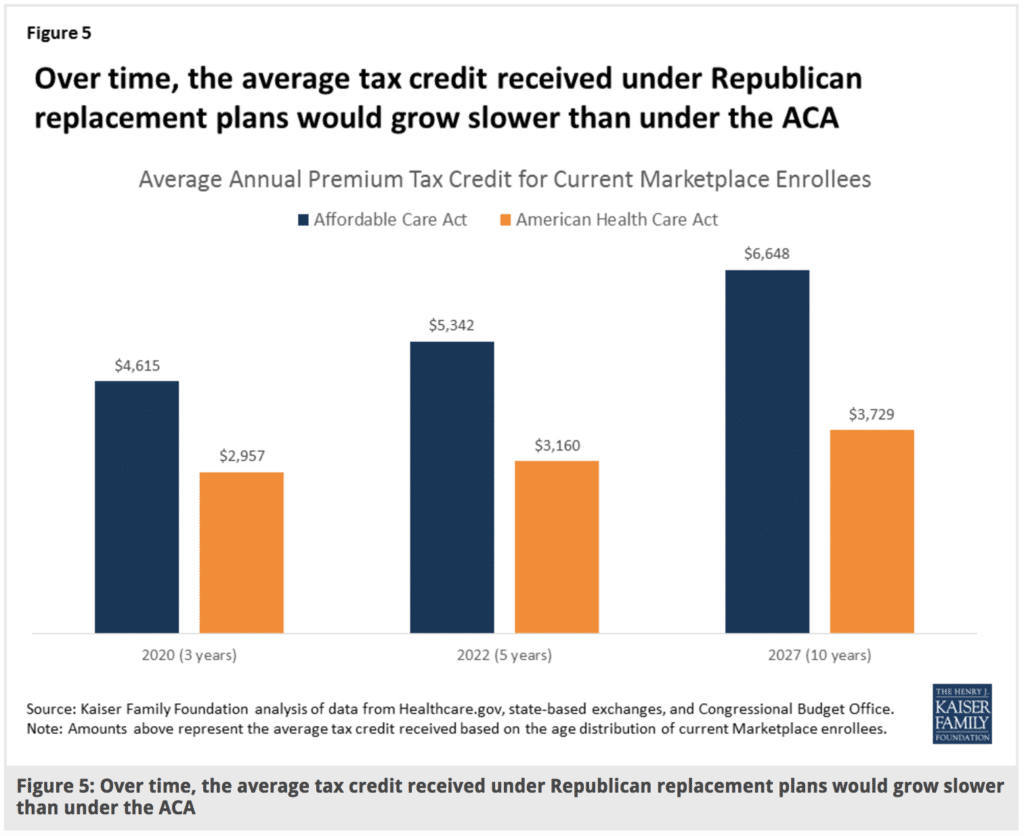
The average estimated tax credit received by ACA marketplace enrollees in 2017 is $3,617 on an annual basis, and that this amount will rise to $4,615 by 2020 based on projected growth rates from the Congressional Budget Office. This includes the 81% who receive premium subsidies as well as the 19% who do not.

We estimate – based on the age distribution of marketplace enrollees – that current enrollees would receive an average tax credit under the American Health Care Act of $2,957 in 2020, or 36% less than under the ACA (see Table 3 and Figure 3). While many people would receive lower tax credits under the Affordable Health Care Act, some would receive more assistance, notably the 19% of current marketplace enrollees who do not qualify for ACA subsidies.


While ACA tax credits grow as premiums increase over time, the tax credits in the American Health Care Act are indexed to inflation plus 1 percentage point. Based on CBO’s projections of ACA tax credit increases and inflation, the disparity between the average credits under the ACA and the two replacement plans would widen over time. The average tax credit current marketplace enrollees would receive under the American Health Care Act would be 41% lower than under the ACA in 2022 and 44% lower in 2027.

Discussion

Like the ACA itself, the American Health Care Act includes refundable tax credits to help make premiums more affordable for people buying their own insurance. This might seem like an area where a replacement plan could preserve a key element of the ACA. However, the tax credits are, in fact, structured quite differently, with important implications for affordability and which groups may be winners or losers if the ACA is repealed and replaced.

For current marketplace enrollees, the American Health Care Act would provide substantially lower tax credits overall than the ACA on average. People who are lower income, older, or live in high premium areas would be particularly disadvantaged under the American Health Care Act. People with incomes over 400% of the poverty level – including those buying individual market insurance outside of the marketplaces – do not get any financial assistance under the ACA but many would receive tax credits under the replacement proposal.

The underlying details of health reform proposals, such as the size and structure of health insurance tax credits, matter crucially in determining who benefits and who is disadvantaged.

Healthcare Polling Data

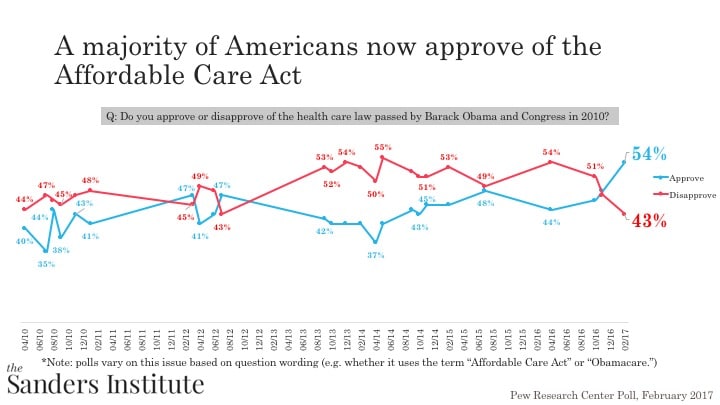
Opinions of the Affordable Care Act (also known as Obamacare) have fluctuated since it was first signed into law in 2010.

It has been the topic of many high-profile court cases and was a key issue in the 2016 Presidential campaign. For the most part, at least a plurality of the American public has disapproved of the ACA since its passage into law. The two outliers are during 2012, which coincides with the 2012 presidential election, and right now. In fact, more Americans approve of the ACA right now (54%) than they ever have.


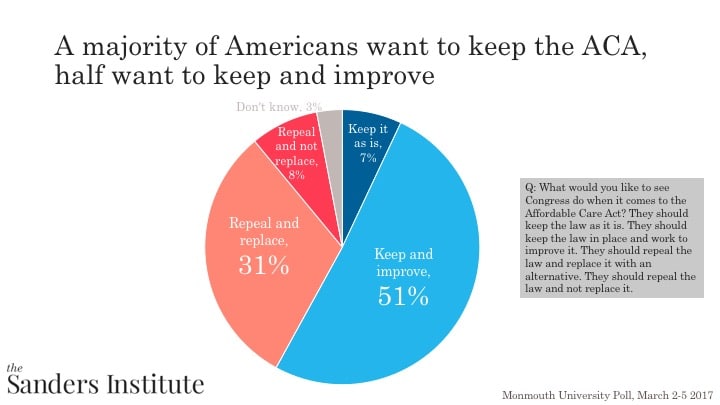
When asked what they would like Congress to do with the law, almost six in ten (58%) Americans want to either keep the law as it is (7%) or keep the law and improve it (51%). In contrast, four in ten (39%) Americans would like to either repeal and replace the law (31%) or repeal with no replacement (8%).


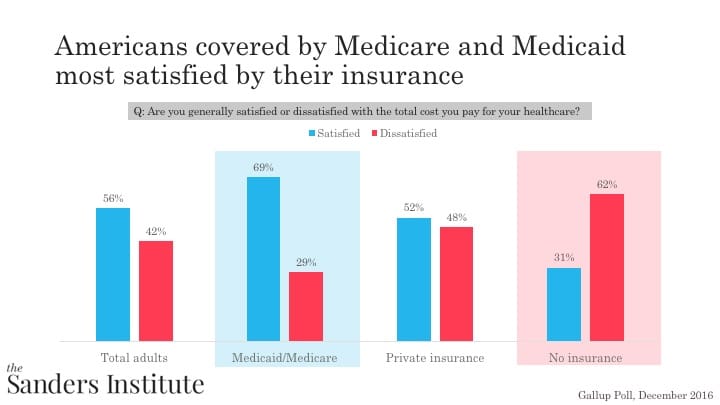
Ultimately, over half (56%) of Americans are satisfied with the cost they pay for insurance. However, the type of insurance is a strong determinant of satisfaction – seven in ten (69%) of individuals on the government programs Medicare and Medicade are satisfied with the cost they pay for insurance, while half (52%) those on private insurance are satisfied and only three in ten (31%) of those without insurance are satisfied.


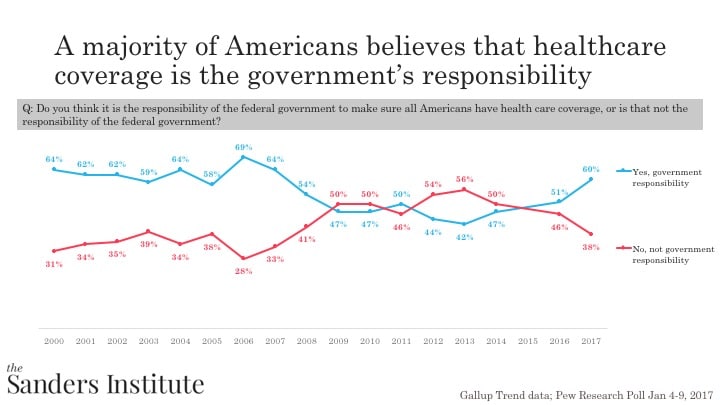
Opininons about whether healthcare coverage is the government responsibility have fluctuated over the years: from 2000 to 2008, a majority of Americans believed that healthcare coverage is the government’s responsibility. Between 2009 and 2016 opinions fluctuated. However, since 2016 there has  been a sharp spike in the number of individuals who think it is the government’s responsibility (60% currently).


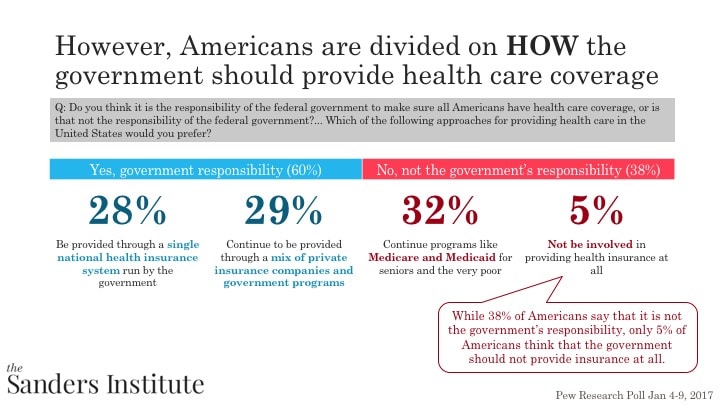
When asked to elaborate about how the government should or should not provide health care coverage, Americans are divided. When looking at those who said that healthcare coverage is the government’s responsibility, Americans are divided half and half. 28% of Americans think that the government should provide healthcare through a single payer system while 29% think that the government should provide healthcare through a mix of private insurance companies and government programs. In contrast, when we look at those who think that it is not the government’s responsibility to provide health care (38%), most want to maintain current programs like Medicaid and Medicare (32% of Americans). In fact, only 5% of Americans would think that the government should not be responsible for healthcare at all.


Honoring Veterans Needs To Go Beyond Lip Service

In this speech, Rep. Tulsi Gabbard talks about the need to take care of the veterans who have dedicated their lives to keeping this country safe. 

She begins with a personal story about members of the military who have given the ultimate sacrifice. Then she turns to what she, and the country, can do to help those who have been lucky enough to come back. Gabbard laments the healthcare situation for servicemen and their families – having to wait months for care. She asks what our response would be to that situation “if that was your son or daughter who had been blown up by an IED who is told to wait 6 months to see a doctor.”


Rep. Gabbard uses the speech to galvanize Americans to re-commit to honoring and taking care of those that put their lives on the line.

“I will never accept defeat. I will never leave a fallen comrade. We will never neglect those who are sick or in need…Let us strengthen our resolve so that we honor our friends and fight for them.”

National Health Expenditures 2015 Highlights

In 2015, U.S. health care spending increased 5.8 percent to reach $3.2 trillion, or $9,990 per person. The coverage expansion that began in 2014 as a result of in the Affordable Care Act continued to have an impact on the growth of health care spending in 2015. Additionally, faster growth in total health care spending in 2015 was driven by stronger growth in spending for private health insurance, hospital care, physician and clinical services, and the continued strong growth in Medicaid and retail prescription drug spending. Lastly, the overall share of the U.S. economy devoted to health care spending was 17.8 percent in 2015, up from 17.4 percent in 2014.

Health Spending by Type of Service or Product:

Hospital Care (32 percent share): Spending for hospital care increased 5.6 percent to $1.0 trillion in 2015 compared to 4.6 percent growth in 2014. The faster growth in 2015 was driven by continued growth in non-price factors such as the use and intensity of services. However, hospital price growth was just 0.9 percent in 2015, which was the lowest rate of growth since 1998. Hospital services, from a payer perspective, experienced faster growth in Medicaid and private health insurance spending; however this strong growth was slightly offset by slower growth in Medicare hospital spending.

Physician and Clinical Services (20 percent share): Spending on physician and clinical services increased 6.3 percent in 2015 to $634.9 billion. This was an acceleration from growth of 4.8 percent in 2014 and was the first time since 2005 that the growth rate exceeded 6.0 percent. As with hospitals, the faster growth in overall physician and clinical services spending was driven by continued growth in non-price factors. Price growth for physician and clinical services, however, declined 1.1 percent in 2015, driven by the expiration of temporary increases in Medicaid payments to primary care physicians.

Other Professional Services (3 percent share): Spending for other professional services reached $87.7 billion in 2015, an increase of 5.9 percent and an acceleration from growth of 5.1 percent in 2014. Spending in this category includes establishments of independent health practitioners (except physicians and dentists) that primarily provide services such as physical therapy, optometry, podiatry, or chiropractic medicine.

Dental Services (4 percent share): Spending for dental services increased 4.2 percent in 2015 to $117.5 billion, which was an acceleration from 2.4 percent growth in 2014. Out-of-pocket spending for dental services (which accounted for 40 percent of dental spending) increased 1.8 percent in 2015 after increasing 0.8 percent in 2014. Private health insurance (which accounted for 47 percent of dental spending) increased 3.0 percent in 2015 following 2.1 percent growth in 2014.

Other Health, Residential, and Personal Care Services (5 percent share): Spending associated with other health, residential, and personal care services grew 7.8 percent in 2015 to $163.3 billion after increasing 5.0 percent in 2014. The robust growth was driven by 10.0 percent growth in Medicaid spending, which represented nearly 57 percent of all spending in this category. This category includes expenditures for medical services that are generally delivered by providers in non-traditional settings such as schools, community centers, and the workplace; as well as by ambulance providers and residential mental health and substance abuse facilities.

Home Health Care (3 percent share): Spending growth for freestanding home health care agencies accelerated in 2015, increasing 6.3 percent to $88.8 billion following growth of 4.5 percent in 2014. Stronger growth in both Medicare (2.6 percent) and Medicaid (6.0 percent) spending — the two largest payers which accounted for 76 percent of home health spending — along with faster growth in private health insurance and out-of-pocket spending drove the overall acceleration in 2015.

Nursing Care Facilities and Continuing Care Retirement Communities (5 percent share): Spending for freestanding nursing care facilities and continuing care retirement communities increased 2.7 percent in 2015 to $156.8 billion. The slightly faster growth in 2015 (from 2.3 percent growth in 2014) was mainly due to the faster growth in Medicare spending of 5.6 percent versus 2.5 percent in 2014.

Prescription Drugs (10 percent share): Retail prescription drug spending decelerated in 2015, increasing 9.0 percent to $324.6 billion. Although growth in 2015 was slower than the 12.4 percent growth in 2014, spending on prescription drugs outpaced all other services in 2015. The strong spending growth for prescription drugs is attributed to the increased spending on new medicines, price growth for existing brand name drugs, increased spending on generics, and fewer expensive blockbuster drugs going off-patent.

Durable Medical Equipment (2 percent share): Retail spending for durable medical equipment, which includes items such as contact lenses, eyeglasses and hearing aids, reached $48.5 billion in 2015, and increased 3.9 percent, slightly faster than the 3.5 percent growth in 2014.

Other Non-durable Medical Products (2 percent share): Retail spending for other nondurable medical products, such as over-the-counter medicines, medical instruments, and surgical dressings, grew 3.7 percent to $59.0 billion in 2015.

Health Spending by Major Sources of Funds:

Medicare (20 percent share): Medicare spending grew 4.5 percent to $646.2 billion in 2015, which was a slight deceleration from the 4.8 growth percent in 2014. The slightly slower growth in 2015 was largely attributable to slower growth in Medicare enrollment, which increased 2.7 percent to 54.3 million beneficiaries following 3.1 percent growth in 2014.

Medicaid (17 percent share): Total Medicaid spending slowed slightly in 2015 to 9.7 percent, but continued the strong growth that began in 2014 (11.6 percent) State and local Medicaid expenditures grew 4.9 percent while Federal Medicaid expenditures increased 12.6 percent in 2015. The increased spending by the federal government was largely driven by newly eligible enrollees under the ACA, which were fully financed by the federal government.

Private Health Insurance (33 percent share): Total private health insurance expenditures increased 7.2 percent to $1.1 trillion in 2015, faster than the 5.8 percent growth in 2014. The acceleration in 2015 was driven by increased enrollment and strong growth in benefit spending.

Out-of-Pocket (11 percent share): Out-of-pocket spending grew 2.6 percent in 2015 to $338.1 billion, slightly faster than the growth of 1.4 percent in 2014. The increase in 2015 was influenced by the expansion of insurance coverage and the corresponding drop in the number of individuals without health insurance.

Health Spending by Type of Sponsor:

In 2015, the federal government accounted for the largest share of health care spending (29 percent), followed by households (28 percent), private businesses (20 percent), and state and local governments (17 percent).

Federal government spending on health increased 8.9 percent in 2015 after growing 11.0 percent in 2014, and outpaced all other sponsors of health care in both years. In 2015, the federal government was the largest sponsor of health care at 29 percent, up from 28 percent in 2014 and 26 percent in 2013. The main driver for the increased federal share of health care was the continued enrollment of newly eligible adults into Medicaid, who were fully financed by the federal government.

Health spending by households grew at a rate of 4.7 percent, which was an acceleration from 2.6 percent in 2014. Household spending accounted for 28 percent of health care spending in 2015, unchanged from the year before. The faster growth in spending by households was driven largely by households’ contributions to employer-sponsored private insurance premiums.

State and local government spending increased 4.6 percent in 2015 compared to 3.2 percent growth in 2014. The acceleration was largely driven by faster growth in state and local Medicaid spending which resulted from increased reimbursement rates and an increased effort to expand care in the home and community setting. Overall, state and local government health care spending represented 17 percent of total health care spending in both 2014 and 2015.

Health care spending financed by private businesses accelerated slightly, increasing 5.3 percent in 2015 compared to 4.7 percent growth in 2014. The private business share of overall health spending has remained fairly steady since 2010, at about 20 percent.

Note: Type of sponsor is defined as the entity that is ultimately responsible for financing the health care bill, such as private businesses, households, and governments. These sponsors pay health insurance premiums and out-of-pocket costs, or finance health care through dedicated taxes and/or general revenues.

National Health Expenditures Fact Sheet

NHE grew 5.8% to $3.2 trillion in 2015, or $9,990 per person, and accounted for 17.8% of Gross Domestic Product (GDP).

Medicare spending grew 4.5% to $646.2 billion in 2015, or 20 percent of total NHE.

Medicaid spending grew 9.7% to $545.1 billion in 2015, or 17 percent of total NHE.

Private health insurance spending grew 7.2% to $1,072.1 billion in 2015, or 33 percent of total NHE.

Out of pocket spending grew 2.6% to $338.1 billion in 2015, or 11 percent of total NHE.

Hospital expenditures grew 5.6% to $1,036.1 billion in 2015, faster than the 4.6% growth in 2014.

Physician and clinical services expenditures grew 6.3% to $634.9 billion in 2015, a faster growth than the 4.8% in 2014.

Prescription drug spending increased 9.0% to $324.6 billion in 2015, slower than the 12.4% growth in 2014.

The largest shares of total health spending were sponsored by the federal government (28.7 percent) and the households (27.7 percent).   The private business share of health spending accounted for 19.9 percent of total health care spending, state and local governments accounted for 17.1 percent, and other private revenues accounted for 6.7 percent.

Projected NHE, 2016-2025:

National health spending is projected to grow at an average rate of 5.6 percent per year for 2016-25, and 4.7 percent per year on a per capita basis.

Health spending is projected to grow 1.2 percentage points faster than Gross Domestic Product (GDP) per year over the 2016-25 period; as a result, the health share of GDP is expected to rise from 17.8 percent in 2015 to 19.9 percent by 2025.

Throughout the 2016-25 projection period, growth in national health expenditures is driven by projected faster growth in medical prices (from historically low growth in 2015 of 0.8 percent to nearly 3 percent by 2025). This faster expected growth in prices is partially offset by projected slowing growth in the use and intensity of medical goods and services.

Although the largest health insurance coverage impacts from the Affordable Care Act’s expansions have already been observed in 2014-15, the insured share of the population is projected to increase from 90.9 percent in 2015 to 91.5 percent in 2025.Health spending growth by federal and state & local governments is projected to outpace growth by private businesses, households, and other private payers over the projection period (5.9 percent compared to 5.4 percent, respectively) in part due to ongoing strong enrollment growth in Medicare by the baby boomer generation coupled with continued government funding dedicated to subsidizing premiums for lower income Marketplace enrollees.

This expectation is mainly a result of continued anticipated growth in private health insurance enrollment, in particular for employer-sponsored insurance, during the first half of the decade in response to faster projected economic growth.

National health spending growth is projected to have decelerated from 5.8 percent in 2015 to 4.8 percent in 2016 as the initial impacts associated with the Affordable Care Act’s major coverage expansions fade. Medicaid spending growth is projected to have decelerated sharply from 9.7 percent in 2015 to 3.7 percent in 2016 as enrollment growth in the program slowed significantly. Similarly, private health insurance spending growth is projected to have slowed from 7.2 percent in 2015 to 5.9 percent in 2016 (also largely attributable to slowing expected growth in enrollment).

Health spending is projected to grow 5.4 percent in 2017 related to faster growth in Medicare and private health insurance spending.

Health expenditures are projected to grow at an average rate of 5.9 percent for 2018-19, the fastest of the sub-periods examined, as projected spending growth in Medicare and Medicaid accelerates.

Through the second half of the projection (2020-25), increasing medical prices are offset by projected decelerations in growth in the use and intensity of medical goods and services, leading to average growth of 5.8 percent per year for national health expenditures.

NHE by Age Group and Gender, Selected Years 2002, 2004, 2006, 2008, 2010, and 2012:

Per person personal health care spending for the 65 and older population was $18,988 in 2012, over 5 times higher than spending per child ($3,552) and approximately 3 times the spending per working-age person ($6,632).

In 2012, children accounted for approximately 25 percent of the population and slightly less than 12 percent of all PHC spending.

The working-age group comprised the majority of spending and population in 2012, almost 54 percent and over 61 percent respectively.

The elderly were the smallest population group, nearly 14 percent of the population, and accounted for approximately 34 percent of all spending in 2012.

Per person spending for females ($8,315) was 22 percent more than males ($6,788) in 2012.

In 2012, per person spending for male children (0-18) was 9 percent more than females.  However, for the working age and elderly groups, per person spending for females was 28 and 7 percent more than for males.

NHE by State of Residence, 1991-2014:

In 2014, per capita personal health care spending ranged from $5,982 in Utah to $11,064 in Alaska.   Per capita spending in Alaska was 38 percent higher than the national average ($8,045) while spending in Utah was about 26 percent lower; they have been the lowest and highest, respectively, since 2012.

Health care spending by region continued to exhibit considerable variation. In 2014, the New England and Mideast regions had the highest levels of total per capita personal health care spending ($10,119 and $9,370, respectively), or 26 and 16 percent higher than the national average.   In contrast, the Rocky Mountain and Southwest regions had the lowest levels of total personal health care spending per capita ($6,814 and $6,978, respectively) with average spending roughly 15 percent lower than the national average.

For 2010-14, average growth in per capita personal health care spending was highest in Alaska at 4.8 percent per year and lowest in Arizona at 1.9 percent per year (compared with average growth of 3.1 percent nationally).

The spread between the highest and the lowest per capita personal health spending across the states has remained relatively stable over 2009-14. Accordingly, the highest per capita spending levels were 80 to 90 percent higher per year than the lowest per capita spending levels during the period.

Medicare expenditures per beneficiary were highest in New Jersey ($12,614) and lowest in Montana ($8,238) in 2014.

Medicaid expenditures per enrollee were highest in North Dakota ($12,413) and lowest in Illinois ($4,959) in 2014.

NHE by State of Provider, 1980-2014:

Between 2009 and 2014, U.S. personal health care spending grew, on average, 3.9 percent per year, with spending in North Dakota growing the fastest (6.7 percent) and spending in Rhode Island growing the slowest (2.5 percent).

In 2014, California’s personal health care spending was highest in the nation ($295.0 billion), representing 11.5 percent of total U.S. personal health care spending. Comparing historical state rankings through 2014, California consistently had the highest level of total personal health care spending, together with the highest total population in the nation. Other large states, New York, Texas, Florida, and Pennsylvania, also were among the states with the highest total personal health care spending.

Wyoming’s personal health care spending was lowest in the nation (as has been the case historically), representing just 0.2 percent of total U.S. personal health care spending in 2014. Vermont, Alaska, North Dakota, and South Dakota were also among the states with the lowest personal health care spending in both 2014 and historically. All these states have smaller populations.

Gross Domestic Product (GDP) by state measures the value of goods and services produced in each state. Health spending as a share of a state’s GDP shows the importance of the health care sector in a state’s economy. As a share of GDP, Maine ranked the highest (22.3 percent) and Wyoming ranked the lowest (9.3 percent) in 2014.