Tag: Minimum Wage

State Minimum Wage Laws

While the Federal minimum wage is $7.25, different state governments have different laws regulating the minimum wage within that state. The map below from the Department of Labor shows which states have minimum wage laws above the federal level, at the federal level, no minimum wage laws, or minimum wage laws below the federal level.

The state minimum wage rate requirements, or lack thereof, are generally controlled by legislative activities within the individual states.

Federal minimum wage law supersedes state minimum wage laws where the federal minimum wage is greater than the state minimum wage. In those states where the state minimum wage is greater than the federal minimum wage, the state minimum wage prevails.

There are 2 states than have a minimum wage set lower than the federal minimum wage. There are 29 states plus the District of Columbia with minimum wage rates set higher than the federal minimum wage. There are 14 states that have a minimum wage requirement that is the same as the federal minimum wage requirement. The remaining 5 states do not have an established minimum wage requirement.

The District of Columbia has the highest minimum wage at $11.50/hour. The states of Georgia and Wyoming have the lowest minimum wage ($5.15/hour) of the 45 states that have a minimum wage requirement.
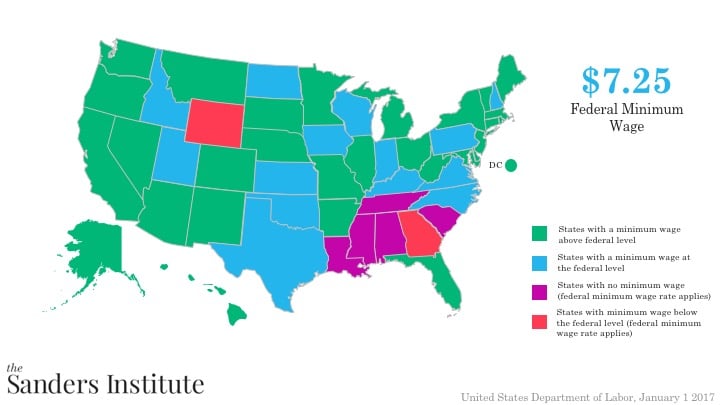


Note: There are 12 states (AK, AZ, CO, FL, MO, MT, NJ, NV, OH, OR, SD, and WA) that have minimum wages that are linked to a consumer price index. As a result of this linkage, the minimum wages in these states are normally increased each year, generally around January 1st. The exception is Nevada which adjusts in the month of July each year. Effective January 1, 2017, seven (7) of the 12 states increased their respective minimum wages.
Raise Wages, Kills Jobs?

Since the passage of the Fair Labor Standards Act in 1938, business interests and conservative politicians have warned that raising the minimum wage would be ruinous. Even modest increases, they’ve asserted, will cause the U.S. economy to hemorrhage jobs, shutter businesses, reduce labor hours, and disproportionately cast young people, so-called low-skilled workers, and workers of color to the bread lines. As recently as this year, the same claims have been repeated, nearly verbatim.

“Raise wages, lose jobs”, the refrain seems to go.

If the claims of minimum-wage opponents are akin to saying “the sky is falling,” this report is an effort to check whether the sky did indeed fall. In this report, we examine the historical data relating to the 22 increases in the federal minimum wage between 1938 and 2009 to determine whether or not these claims—that if you raise wages, you will lose jobs—can be substantiated. We examine employment trends before and after minimum-wage increases, looking both at the overall labor market and at key indicator sectors that are most affected by minimum-wage increases. Rather than an academic study that seeks to measure causal effects using techniques such as regression analysis, this report assesses opponents’ claims about raising the minimum wage on their own terms by examining simple indicators and job trends.

The results were clear: these basic economic indicators show no correlation between federal minimum-wage increases and lower employment levels, even in the industries that are most impacted by higher minimum wages. To the contrary, in the substantial majority of instances (68 percent) overall employment increased after a federal minimum-wage increase. In the most substantially affected industries, the rates were even higher: in the leisure and hospitality sector employment rose 82 percent of the time following a federal wage increase, and in the retail sector it was 73 percent of the time. Moreover, the small minority of instances in which employment—either overall or in the indicator sectors—declined following a federal minimum-wage increase all occurred during periods of recession or near recession. That pattern strongly suggests that the few instances of such declines in employment are better explained by the overall national business cycle than by the minimum wage.

These employment trends after federal minimum-wage increases are not surprising, as they are in line with the findings of the substantial majority of modern minimum-wage research. As Goldman Sachs analysts recently noted, citing a state-of-the-art 2010 study by University of California economists that examined job-growth patterns across every border in the U.S. where one county had a higher wage than a neighboring county, “the economic literature has typically found no effect on employment” from recent U.S. minimum-wage increases.1 This report’s findings mirror decades of more sophisticated academic research, providing simple confirmation that opponents’ perennial predictions of job losses when minimum-wage increases are proposed are rooted in ideology, not evidence.

KEY FINDINGS

The federal minimum wage has been raised a total of 22 times since its enactment in 1938. The simplest way to assess the claim that raising the minimum wage costs jobs is to treat each minimum-wage increase as a distinct event and look and see what happened to employment or other indicators one year later.

While opponents often broadly charge that raising the minimum wage “will cause job losses,” such increases disproportionately affect a select few employment sectors. The bulk of workers receiving raises as the result of minimum-wage increases are concentrated in a group of service industries—the two largest being restaurants and retail. For that reason, we examine employment trends, both overall and with a special focus on these indicator industries in which any adverse impact resulting from a higher minimum wage would most likely be evident.

Our findings are quite clear: in the nearly two dozen instances when the federal minimum wage has been increased, employment the following year has increased in the substantial majority of instances.

This pattern of increased job growth following minimum-wage increases holds true both for general labor-market indicators as well as those for industries heavily affected by minimumwage increases:

  • In the 22 instances when the federal minimum wage went up, the change in total private employment after one year was positive 15 out of 22 times (68.2 percent).
  • In the 16 instances when the federal minimum wage was increased since 1964 (the earliest year for which this data is available), total hours worked increased 10 out of 16 times (62.5 percent). ?
  • In the leisure and hospitality sector, which includes restaurants, hotels, and amusement parks, employment rose one year after a minimum-wage increase 18 out of 22 times (81.8 percent). ?
  • In retail employment, positive changes occurred 72.7 percent of the time after an increase.

What’s more, looking more closely at the relative handful of instances in which employment decreased—whether total employment, or employment in our key indicator sectors—it is also clear that those declines were likely driven by factors other than the higher minimum wage.

Specifically, in five out of eight instances where either total or industry-specific employment took a negative turn during the one-year period following a minimum-wage increase, the employment decreases happened during periods when the U.S. economy was officially in recession.

In the remaining three instances, a recession was just around the corner (the decline shown during the period of March 1956-1957 would be swiftly followed by the Recession of 1958, during which time the U.S. automotive industry saw its worst year since World War II), or the economy was still recovering from a recessionary period (decreases in both the April 1991-1992 and July 2009-2010 periods occurred just months after a recessionary period had technically ended, but the economy was still feeling the effects).

In each of the relatively few instances in which employment declined following a federal minimum-wage increase, the economy was either in recession or near a recession. In all other instances, employment grew after the federal minimum wage went up. These patterns show that federal minimum-wage increases have not correlated with reductions in jobs, and in the few instances where they have, the decline was better explained by the business cycle than by the minimum wage.

This is not to say that individual firms may not change their employment decisions in response to higher minimum wages. But it shows that in the aggregate, across firms and across the economy, there is no pattern of reduced employment when the federal minimum wage goes up—and the few instances when employment has gone down after wage increases have been during recessions or near recessions—circumstances that much more plausibly explain the observed employment reductions than the modest minimum-wage increases.

CONCLUSION

For decades, minimum-wage opponents have been doom-saying about the likely impact of higher wages on the economy. But review of the best evidence makes clear that their predictions have not been borne out by real-world results. Our analysis of simple job-growth data—both economy-wide and in the industries most affected by higher minimum wages— shows that there is no correlation between minimum-wage increases and reduced employment levels. As those results mirror the findings of decades of more sophisticated academic research, they provide simple confirmation that opponents’ perennial predictions of job losses are rooted in ideology, not evidence.

The Big Picture: Fight For $15

Right now, there are adult breadwinners who work full-time, or more than full-time, and still live in poverty. If the minimum wage in 1968 had simply kept up with inflation, it would be more than $10 today. If it also kept up with the added productivity of American workers since then, it would be more than $21 an hour. A decent society ensures that all workers get a decent wage. It’s the least we can do. And a $15 wage is the place to start.


Minimum Wage Vs. Purchasing Power

The following is a summary of the Congressional Research Service on the minimum wage.

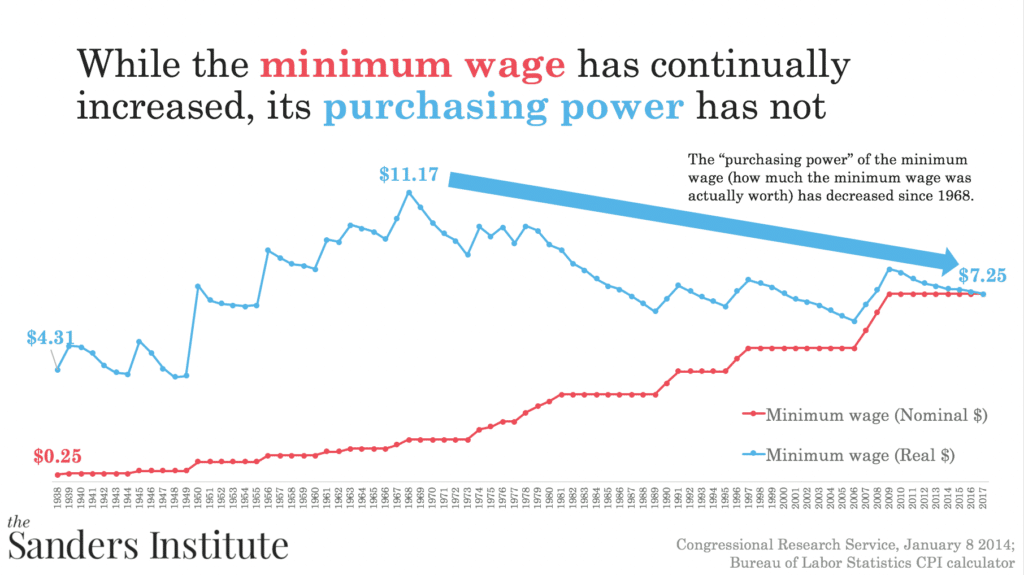
The Fair Labor Standards Act (FLSA) of 1938 established the hourly minimum wage rate at 25 cents for covered workers. Since then, it has been raised 22 separate times, in part to keep up with rising prices. Most recently, in July 2009, it was increased to $7.25 an hour. Because there have been some extended periods between these adjustments while inflation generally has increased, the real value (purchasing power) of the minimum wage has decreased substantially over time.

The minimum wage is not indexed to the price level. It has been legislatively increased from time to time to make up for the loss in its real value caused by inflation. In nominal (current dollar) terms, the minimum wage has risen steadily from 25 cents to $7.25 an hour, where it has remained since its effective date of July 2009. As the legislated adjustments to the minimum wage standard have occurred at irregular intervals—sometimes increasing annually, other times not for several years—while prices have generally risen each year, the purchasing power (real or constant dollar value) of the minimum wage has varied considerably since its enactment.


For each time the minimum wage was changed, the graph above presents its nominal and real value. The inflation adjustments to the minimum wage are made using the Consumer Price Index for Urban Wage Earners and Clerical Workers (CPI-W). Real values of the minimum wage are expressed in terms of July 2017 dollars, the latest month for which the index is available at the time of this Sanders Institute article’s preparation.

The peak value of the minimum wage in real terms was reached in 1968.  Although the nominal value of the minimum wage was increased between 1968 and 2009, these legislated adjustments did not enable the minimum wage to keep pace with the increase in consumer prices, so the real minimum wage fell.