Tag: Social Security

The GOP Wants To Eliminate The Estate Tax. Let’s Use It To Expand Social Security Instead

Of the many giveaways to the super-rich in the Republican tax bill, the elimination of the estate tax stands out. This tax, the government’s most progressive source of revenue, does not affect 99.8 percent of Americans. Rather, it is paid by Republicans’ billionaire donors.

The United States has the largest number of billionaires in the world; their combined wealth is measured in the trillions of dollars. Perhaps not surprisingly, Republican politicians, whose campaigns the billionaires fund, want to repeal the estate tax, so the privileged children of those donors will be even richer. To use Donald Trump’s words, eliminating the federal estate tax is “a big, beautiful Christmas present” to super-privileged children — those born to multi-millionaires and billionaires.

Our nation is founded on the idea that we are created equal. The reality is that children of billionaires have many opportunities denied to the rest of us. Instead of making those children even richer and more privileged, here’s a better idea: If Republicans don’t want the revenue from that top 0.2 percent of wealthiest Americans to run the government, let’s dedicate it to Social Security and use it to expand those modest but vital benefits for everyone.

There are sound reasons for doing so. As a result of tax giveaways, the deregulation of Wall Street, and other policies favoring the rich, we have seen enormous wealth redistributed upwards to the most affluent Americans over the last thirty-five years. Meanwhile, the rest of us have been running in place or, worse, falling behind.

Rising inequality is a key driver of the retirement income crisis facing our country. It’s all but impossible for working- and middle-class families to prepare for retirement when nearly all of the income gains are going to the wealthiest 1 percent of the population.

Inequality is also a major factor behind Social Security’s projected modest funding shortfall. The vast majority of workers contribute to Social Security with every paycheck, but when their wages are stagnant, so are their Social Security contributions. The percentage of wages paid as current cash compensation has also declined sharply as health insurance has accounted for a bigger and bigger portion of employee compensation.

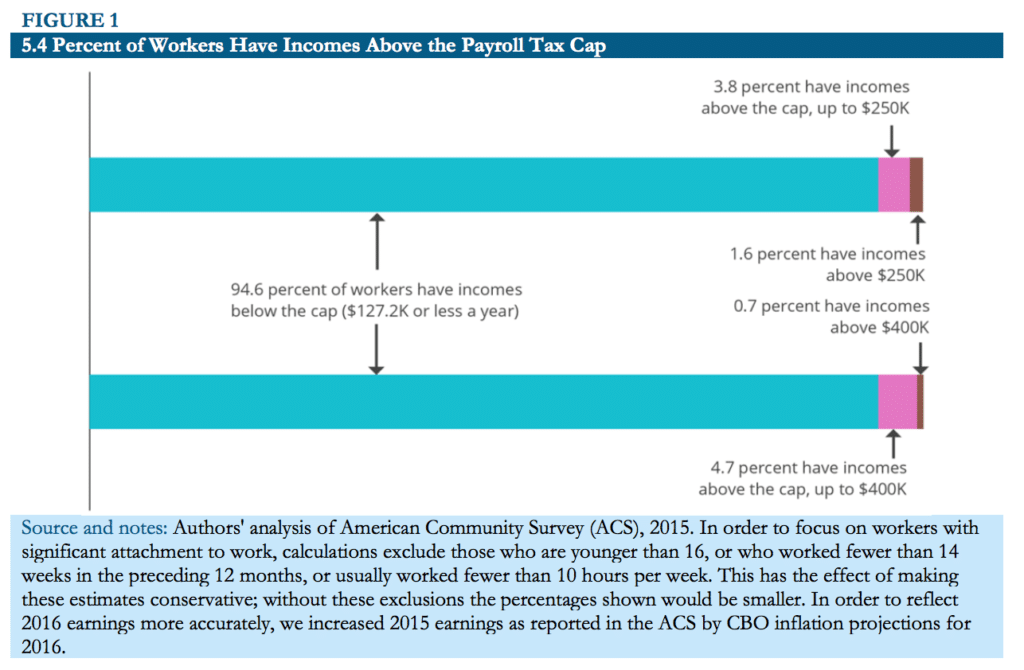
Meanwhile, the bulk of income gains captured by the wealthy either fall above Social Security’s maximum earnings contribution cap (currently $127,200), or are unearned income on which they do not pay Social Security contributions.

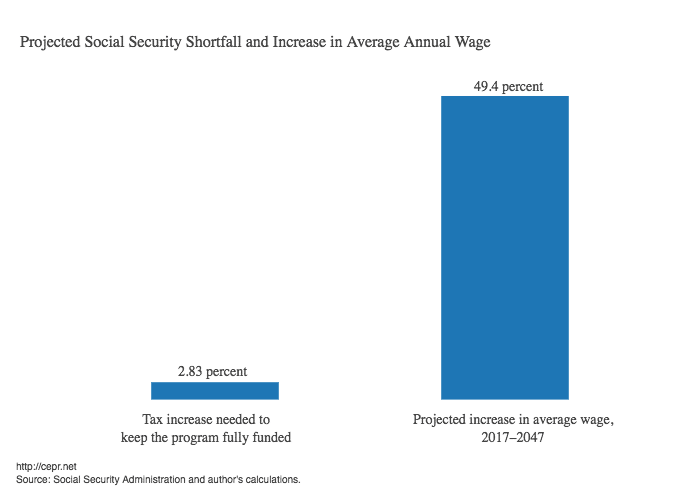
Since the earnings of high-income workers have increased much more rapidly than the average in the last several decades, Social Security now covers only about 82 percent of all wages. In 2016 alone, those at the top paid $80 billion less to Social Security, only because the cap has slipped from covering 90 percent of wages, as Congress intended, to 82 percent today. Those are billions of dollars that should have gone to Social Security but instead stayed in the pockets of the wealthiest among us. Unquestionably, the richest are not paying their fair share into Social Security.

The idea of scrapping the cap – eliminating the annual limit on wages subject to Social Security – is one that most Americans favor. Congress should do this. But that simply requires the wealthy to pay the same rate on earned income as everyone else. Most of their wealth is in stocks and other unearned income, which is currently shielded, so that none of it goes to Social Security.

Given the role of wealth and income inequality in creating both the retirement income crisis and Social Security’s modest shortfall, it is only fair that billionaires contribute more. Opponents of the federal estate tax like to call it a death tax. But what could be more generous than to only tax the billionaires’ wealth once they are dead and gone?

Isn’t it more than fair that their heirs, who had nothing to do with creating the wealth, receive most of it, but not every single penny of it? Isn’t it more than fair that a small piece of all that wealth go to the rest of us, without whom that wealth would never have been amassed?

After all, that wealth would have been impossible without the highways, courts, military, and other expenditures all of us paid for through our taxes. Requiring the very wealthiest Americans to forgo a portion of their fortune — on a one-time basis, only after death — to improve the economic security of all seems a reasonable minimum to require of those who have benefited so greatly from America’s commonwealth (i.e. common wealth).

The idea of a tax on inherited wealth goes back to our country’s founding. This is not surprising. After all, our founders were rebelling against the British king and aristocracy, against inherited wealth and position.

Thomas Paine, famed as the author of Common Sense, also wrote Agrarian Justice, in which he advocated an estate tax. He argued that it should be used to pay for pensions for older Americans and people with disabilities. We have caught up to part of Thomas Paine’s vision by creating our Social Security system. Now, it’s time for us to catch up to the financing part.

The late Robert M. Ball, the longest serving Social Security commissioner and widely recognized as the foremost expert on our nation’s Social Security system, dedicated his life to protecting and expanding the program. Like Thomas Paine, he believed that the estate tax should be dedicated to Social Security.

[The best alternative is to propose] that the estate tax be dedicated to Social Security and used to expand benefits for everyone.

That would be in keeping with the wisdom of founder of the nation, Thomas Paine, and founder of Social Security, Robert Ball. Dedication of the estate tax to Social Security while increasing its benefits would begin to combat income inequality and address our looming retirement income crisis.

The Next Big Fight Of Social Security, Medicare, And Medicaid

Fresh off passing massive tax cuts for corporations and the wealthy, Trump and congressional Republicans want to use the deficit they’ve created to justify huge cuts to Social Security, Medicare, and Medicaid.

As House Speaker Paul Ryan says “We’re going to have to get… at entitlement reform, which is how you tackle the debt and the deficit.”

Don’t let them get away with it.

Social Security and Medicare are critical safety-nets for working and middle-class families.

Before they existed, Americans faced grim prospects. In 1935, the year Social Security was enacted, roughly half of America’s seniors lived in poverty.  By the 1960s poverty among seniors had dropped significantly, but medical costs were still a major financial burden and only half of Americans aged 65 and over had health insurance. Medicare fixed that, guaranteeing health care for older Americans.

Today less than 10 percent of seniors live in poverty and almost all have access to health care. According to an analysis of census data, Social Security payments keep an estimated 22 million Americans from slipping into poverty.

Medicaid is also a vital lifeline for America’s elderly and the poor. Yet the Trump administration has already started whittling it away by encouraging states to impose work requirements on Medicaid recipients.

Republicans like to call these programs “entitlements,” as if they’re some kind of giveaway.  But Americans pay into Social Security and Medicare throughout their entire working lives. It’s Americans’ own money they’re getting back through these programs.

These vital safety nets should be strengthened, not weakened. How?

1. Lift the ceiling on income subject to the Social Security tax. Currently, top earners only pay Social Security taxes on the first $120,000 of their yearly income. So the rich end up, in effect,  paying a lower Social Security tax rate than everyone else. Lifting the ceiling on what wealthy Americans contribute would help pay for the Baby Boomers retirements and leave Social Security in good shape for Millennials.

2. Allow Medicare to negotiate with drug companies for lower prescription drug prices. As the nation’s largest insurer, Medicare has tremendous bargaining power. Why should Americans pay far more for drugs than people in any other country?

3. Finally, reduce overall health costs and create a stronger workforce by making Medicare available to all. There’s no excuse for the richest nation in the world to have 28 million Americans still uninsured.

We need to not just secure, but revitalize Social Security and these other programs for our children, and for our children’s children.  Millennials just overtook Baby Boomers as our nation’s largest demographic.  For them — for all of us — we need to say loud and clear to all of our members of congress:  Hands off Medicare, Medicaid, and Social Security. Expand and improve these programs: don’t cut them.

Long-Term Projections Of Social Security’s And Medicare’s Financing Are Not As Scary As They Seem

With the release of the annual Social Security and Medicare trustees’ report, President Trump’s appointees endorsed sharp improvements in Medicare’s financing that occurred under former President Obama. Medicare had a projected shortfall of 3.54 percent of covered payroll (over a 75-year planning period) during the last year of the Bush administration, now it is down to just 0.64 percent.

This development should give pause to those who wish to fundamentally restructure Social Security and Medicare based on these projections. A lot changed over the eight years of the Obama administration and even more can change over 75 years. This is worth taking into account when looking at Social Security’s 75-year shortfall, which is at 2.83 percent of payroll under the intermediate scenario.

The figure below compares the tax increase that would be required to fully fund Social Security — 2.83 percent — with the projected increase in average wages over the next 30 years. The tax increase is dwarfed by the increase in wages over this period, which would be 49.4 percent by the trustees’ own estimates. Wage increases are over 17 times more important than the tax increase.


The next figure is a simple projection of what would happen to a salary of $50,000 per year in 2016 ($46,900 with the current Social Security taxes taken out) over the same 30-year period. With the current Social Security tax rate, this salary would be $69,018 per year in 2047 based on the average wage increase. With Social Security fully funded, it would be $66,936.


It’s unlikely that these projections will hold over such a long time frame, but this should demonstrate that workers should be much more concerned with making sure they receive their share of productivity gains in wage increases over this period than they should be about tax increases. This is not about Social Security needing to be less generous, it is about making sure that workers receive their fair share.

In fact, this problem cuts the other way as well. Unlike Medicare taxes which apply to entire incomes, Social Security taxes apply only up to a threshold — the payroll tax cap — which was set at $127,200 in 2017. With the upward redistribution of income that has occurred over the last four decades, Social Security has less of a base on which to draw. 90 percent of wage income was subject to the tax in 1983 — it was 82.6 percent in 2015. This decline represents a large share of the program’s shortfall.

For Social Security, as with Medicare, long-term financing problems are not indicative of inherent or intractable problems with social programs. Rather, they are indicative of other problems, like policies that redistribute income upwards, and they are fixable.

Who Pays If We Raise The Social Security Payroll Tax Cap?

Most Americans know that their earnings are subject to the Social Security payroll tax. Not as many are aware that the amount of earnings subject to the tax, while subject to change, is capped at the same level for everyone, regardless of total earnings. This year, the maximum wage earnings subject to the payroll tax is $127,200.

The cap on the Social Security payroll tax means that those with the highest earnings pay a lower rate. People who earn a million dollars a year pay this tax on about an eighth of their earnings. People who earn a quarter of a million dollars pay the tax on just over half of their earnings. It is important to note that this just applies to wage earnings, not other forms of income. If an individual earning $250,000 a year makes another $250,000 from investments, then they end up paying the Social Security income tax on about a fourth of their income. The vast majority of workers fall below the $127,200 cap and have significantly less stock or other income, if any. As a result, all — or the majority — of their income is typically subject to the payroll tax.

The Social Security payroll tax essentially finances what is commonly called Social Security, the Old-Age, Survivors, and Disability Insurance program (OASDI). The contributions from the tax (6.2 percent paid by employees and employers, 12.4 percent by the self-employed) are held by the Social Security Trust Fund as Treasury bonds and are the source of Social Security benefits for retirees.

The latest Social Security Trustees report showed the Trust Fund at $2.8 trillion. This is enough to pay full benefits to retirees through 2034. At that point, the fund will still be able to pay just under 80 percent of full benefits for the next 75 years. Over this period of time, the gap between full benefits and payable benefits comes out to roughly one percent of GDP over this period.

There are a number of ways this gap can be eliminated to not only ensure that full benefits are paid beyond 2034, but expanded to provide additional retirement security for millions of workers. Proposals to raise or totally eliminate the payroll tax cap would have a significant impact on benefit payments and the program’s projected shortfall after 2034. Such proposals ensure that high-income earners pay as much, or closer to, the same rate as everyone else, thus addressing the regressive nature of the tax.

Raising the cap also addresses the impact of rising wage inequality on financing Social Security benefits. While wages for the top 1 percent of wage earners have continued to grow at a strong pace over the past few decades, they have slowed considerably for low- and moderate-income earners.4 As of 2013, this rising inequality in earnings was responsible for 43.5 percent5 of the projected 75- year shortfall in Social Security funding.

A number of bills were authored in the 114th Congress to shore up and strengthen Social Security —several looked, at least in part, at the Social Security payroll tax cap. Senator Bernie Sanders authored legislation similar to a bill he introduced the previous year and featured it in his 2016 presidential campaign platform that would have applied the payroll tax cap to earnings above $250,000. According to an analysis from the Social Security office of the Chief Actuary, this would have eliminated 80 percent of the projected Trust Fund shortfall. Other legislation by Senator Richard Blumenthal and Representative John Larson would have lifted the cap for those earning more than $400,000. Another bill, sponsored by Senator Patty Murray, would have imposed a 2.0 percent surtax on employers and employees if the employee’s earnings were above $400,000 and a surtax of 4.0 percent if an individual were self-employed.

Using Census Bureau data from the latest American Community Survey (ACS), this issue brief updates previous CEPR research to determine how many people would be affected if the payroll tax cap were raised or eliminated. Based on this data, the vast majority of workers would not be impacted. Roughly 1 in 18 people, or 5.4 percent of workers, earn more than the current cap and would be affected if it were eliminated (Figure 1). If workers who earn over $250,000 in wages paid the tax, the top 1.6 percent of workers would be affected. If the cap applied to people who earn over $400,000 in wages, only the top 0.7 percent would be affected.


The effects of eliminating or raising the Social Security payroll tax cap vary widely when looking at race, gender, age, and state of residence. For instance, about 1 in 53 black and Latino workers would pay more if the cap were completely scrapped. A little more than 1 in 35 women would pay additional taxes if the cap were eliminated.

Social Security Frequently Asked Questions

Q1: When did Social Security start?

A: The Social Security Act was signed by FDR on 8/14/35. Taxes were collected for the first time in January 1937 and the first one-time, lump-sum payments were made that same month. Regular ongoing monthly benefits started in January 1940.

Q2: What is the origin of the term “Social Security?”

A: The term was first used in the U.S. by Abraham Epstein in connection with his group, the American Association for Social Security. Originally, the Social Security Act of 1935 was named the Economic Security Act, but this title was changed during Congressional consideration of the bill. (The full story has been recounted by Professor Edwin Witte who was present at the event.)

Q3: When did Medicare start?

A: Medicare was passed into law on July 30, 1965 but beneficiaries were first able to sign-up for the program on July 1, 1966.

Q4: Is it true that Social Security was originally just a retirement program?

A: Yes. Under the 1935 law, what we now think of as Social Security only paid retirement benefits to the primary worker. A 1939 change in the law added survivors benefits and benefits for the retiree’s spouse and children. In 1956 disability benefits were added.

Keep in mind, however, that the Social Security Act itself was much broader than just the program which today we commonly describe as “Social Security.” The original 1935 law contained the first national unemployment compensation program, aid to the states for various health and welfare programs, and the Aid to Dependent Children program. (Full text of the 1935 law.)

Q5: Is it true that members of Congress do not have to pay into Social Security?

A: No, it is not true. All members of Congress, the President and Vice President, Federal judges, and most political appointees, were covered under the Social Security program starting in January 1984. They pay into the system just like everyone else. Thus all members of Congress, no matter how long they have been in office, have been paying into the Social Security system since January 1984.

(Prior to this time, most Federal government workers and officials were participants in the Civil Service Retirement System (CSRS) which came into being in 1920–15 years before the Social Security system was formed. For this reason, historically, Federal employees were not participants in the Social Security system.)

Employees of the three branches of the federal government, were also covered starting in January 1984, under the 1983 law–but with some special transition rules.

  1. Executive and judicial branch employees hired before January 1, 1984 were given a one-time irrevocable choice of whether to switch to Social Security or stay under the old CSRS. (Rehired employees–other than rehired annuitants–are treated like new employees if their break-in-service was more than a year.)
  2. Employees of the legislative branch who were not participating in the CSRS system were mandatorily covered, regardless of when their service began. Those who were in the CSRS system were given the same one-time choice as employees in the executive and judicial branches.
  3. All federal employees hired on or after January 1, 1984 are mandatorily covered under Social Security–the CSRS system is not an option for them.

So there are still some Federal employees, those first hired prior to January 1984, who are not participants in the Social Security system. All other Federal government employees participate in Social Security like everyone else.

This change was part of the 1983 Amendments to Social Security. You can find a summary of the 1983 amendments elsewhere on this site.

Q6: Is is true that the age of 65 was chosen as the retirement age for Social Security because the Germans used 65 in their system, and the Germans used age 65 because their Chancellor, Otto von Bismarck, was 65 at the time they developed their system?

A: No, it is not true. Generally, age 65 was chosen to conform to contemporary practice during the 1930s.

More details:

Germany became the first nation in the world to adopt an old-age social insurance program in 1889, designed by Germany’s Chancellor, Otto von Bismarck. The idea was first put forward, at Bismarck’s behest, in 1881 by Germany’s Emperor, William the First, in a ground-breaking letter to the German Parliament. William wrote: “. . . those who are disabled from work by age and invalidity have a well-grounded claim to care from the state.”

One persistent myth about the German program is that it adopted age 65 as the standard retirement age because that was Bismarck’s age. In fact, Germany initially set age 70 as the retirement age (and Bismarck himself was 74 at the time) and it was not until 27 years later (in 1916) that the age was lowered to 65. By that time, Bismarck had been dead for 18 years.

By the time America moved to social insurance in 1935 the German system was using age 65 as its retirement age. But this was not the major influence on the Committee on Economic Security (CES) when it proposed age 65 as the retirement age under Social Security. This decision was not based on any philosophical principle or European precedent. It was, in fact, primarily pragmatic, and stemmed from two sources. One was a general observation about prevailing retirement ages in the few private pension systems in existence at the time and, more importantly, the 30 state old-age pension systems then in operation. Roughly half of the state pension systems used age 65 as the retirement age and half used age 70. The new federal Railroad Retirement System passed by Congress earlier in 1934, also used age 65 as its retirement age. Taking all this into account, the CES planners made a rough judgment that age 65 was probably more reasonable than age 70. This judgment was then confirmed by the actuarial studies. The studies showed that using age 65 produced a manageable system that could easily be made self-sustaining with only modest levels of payroll taxation. So these two factors, a kind of pragmatic judgment about prevailing retirement standards and the favorable actuarial outcome of using age 65, combined to be the real basis on which age 65 was chosen as the age for retirement under Social Security. With all due respect to Chancellor Bismarck, he had nothing to do with it.

Q7: Is it true that life expectancy was less than 65 back in 1935, so the Social Security program was designed in such a way that people would not live long enough to collect benefits?

A: Not really. Life expectancy at birth was less than 65, but this is a misleading measure. A more appropriate measure is life expectancy after attainment of adulthood, which shows that most Americans could expect to live to age 65 once they survived childhood.

More details:

If we look at life expectancy statistics from the 1930s we might come to the conclusion that the Social Security program was designed in such a way that people would work for many years paying in taxes, but would not live long enough to collect benefits. Life expectancy at birth in 1930 was indeed only 58 for men and 62 for women, and the retirement age was 65. But life expectancy at birth in the early decades of the 20th century was low due mainly to high infant mortality, and someone who died as a child would never have worked and paid into Social Security. A more appropriate measure is probably life expectancy after attainment of adulthood.

As Table 1 shows, the majority of Americans who made it to adulthood could expect to live to 65, and those who did live to 65 could look forward to collecting benefits for many years into the future. So we can observe that for men, for example, almost 54% of the them could expect to live to age 65 if they survived to age 21, and men who attained age 65 could expect to collect Social Security benefits for almost 13 years (and the numbers are even higher for women).

Also, it should be noted that there were already 7.8 million Americans age 65 or older in 1935 (cf. Table 2), so there was a large and growing population of people who could receive Social Security. Indeed, the actuarial estimates used by the Committee on Economic Security (CES) in designing the Social Security program projected that there would be 8.3 million Americans age 65 or older by 1940 (when monthly benefits started). So Social Security was not designed in such a way that few people would collect the benefits.

As Table 1 indicates, the average life expectancy at age 65 (i.e., the number of years a person could be expected to receive unreduced Social Security retirement benefits) has increased a modest 5 years (on average) since 1940. So, for example, men attaining 65 in 1990 can expect to live for 15.3 years compared to 12.7 years for men attaining 65 back in 1940.

(Increases in life expectancy are a factor in the long-range financing of Social Security; but other factors, such as the sheer size of the “baby boom” generation, and the relative proportion of workers to beneficiaries, are larger determinants of Social Security’s future financial condition.)


Q8: When did COLAs (cost-of-living allowances) start?

A: COLAs were first paid in 1975 as a result of a 1972 law. Prior to this, benefits were increased irregularly by special acts of Congress.

The Story of COLAs:

Most people are aware that there are annual increases in Social Security benefits to offset the corrosive effects of inflation on fixed incomes. These increases, now known as Cost of Living Allowances (COLAs), are such an accepted feature of the program that it is difficult to imagine a time when there were no COLAs. But in fact, when Ida May Fuller received her first $22.54 benefit payment in January of 1940, this would be the same amount she would receive each month for the next 10 years. For Ida May Fuller, and the millions of other Social Security beneficiaries like her, the amount of that first benefit check was the amount they could expect to receive for life. It was not until the 1950 Amendments that Congress first legislated an increase in benefits. Current beneficiaries had their payments recomputed and Ida May Fuller, for example, saw her monthly check increase from $22.54 to $41.30.

These recomputations were effective for September 1950 and appeared for the first time in the October 1950 checks. A second increase was legislated for September 1952. Together these two increases almost doubled the value of Social Security benefits for existing beneficiaries. From that point on, benefits were increased only when Congress enacted special legislation for that purpose.

In 1972 legislation the law was changed to provide, beginning in 1975, for automatic annual cost-of-living allowances (i.e., COLAs) based on the annual increase in consumer prices. No longer do beneficiaries have to await a special act of Congress to receive a benefit increase and no longer does inflation drain value from Social Security benefits.

Q9: What information is available from Social Security records to help in genealogical research?

A: You might want to start by checking out the Social Security Death Index which is available online from a variety of commercial services (usually the search is free). The Death Index contains a listing of persons who had a Social Security number, who are deceased, and whose death was reported to the Social Security Administration. (The information in the Death Index for people who died prior to 1962 is sketchy since SSA’s death information was not automated before that date. Death information for persons who died before 1962 is generally only in the Death Index if the death was actually reported to SSA after 1962, even though the death occurred prior to that year.)

If you find a person in the Death Index you will learn the date of birth and Social Security Number for that person. (The Social Security Death Index is not published by SSA for public use, but is made available by commercial entities using information from SSA records. We do not offer support of these commercial products nor can we answer questions about the material in the Death Index.)

Other records potentially available from SSA include the Application for a Social Security Number (form SS-5). To obtain any information from SSA you will need to file a Freedom of Information Act (FOIA) request.

Q10: Does Social Security have any lists of the most common names in use in the U.S.?

A: Yes, based on the applications for Social Security cards, SSA’s Office of the Actuary has done a series of special studies of the most common names.

Q11: Where do I get more information about the Social Security program as it exists today?

A: Go to the Social Security Online home page.

Q12: Who was the first person to get Social Security benefits?

A: A fellow named Ernest Ackerman got a payment for 17 cents in January 1937. This was a one-time, lump-sum pay-out–which was the only form of benefits paid during the start-up period January 1937 through December 1939.

Q13: If Ernest Ackerman only received a single lump-sum payment, who was the first person to received ongoing monthly benefits?

A: A woman named Ida May Fuller , from Ludlow, Vermont was the first recipient of monthly Social Security benefits.

Q14: How many people, annually, have received Social Security payments?

A: This history is available as a detailed table. (Payment history table)

There is also a (PDF-format) table which shows the minimum and maximum Retirement Benefit amounts over the years.

Q15: What is the “notch”?

A: In 1972 a technical error was introduced in the law which resulted in beneficiaries getting a double adjustment for inflation. In 1977 Congress acted to correct the error. Instead of making the correction immediate, they phased it in over a five year period (this is the notch period). This phase-in period was defined as affecting those people born in 1917-1921. Individuals in the notch generally receive higher benefits than those born after the notch, although they receive lower benefits than those born in the period prior to the notch when the error was in effect.

Q16: Where can I find the history of the tax rates over the years and the amount of earnings subject to Social Security taxes?

A: The history of the tax rates is available as an Adobe PDF file. (Tax rate table). There is also a table showing the maximum amount of Social Security taxes that could have been paid since the program began.

There are also tables showing the minimum and maximum Social Security benefitfor a retired worker who retires at age 62 and one who retires at age 65.

Also, there is a table showing the number of workers paying into Social Security each year. (Covered workers table) And also a table showing the ratio of covered workers to beneficiaries. (Ratio table)

Q17: What does FICA mean and why are Social Security taxes called FICA contributions?

A: Social Security payroll taxes are collected under authority of the Federal Insurance Contributions Act (FICA). The payroll taxes are sometimes even called “FICA taxes.” In the original 1935 law the benefit provisions were in Title II of the Act and the taxing provisions were in a separate title, Title VIII. As part of the 1939 Amendments, the Title VIII taxing provisions were taken out of the Social Security Act and placed in the Internal Revenue Code. Since it wouldn’t make any sense to call this new section of the Internal Revenue Code “Title VIII,” it was renamed the “Federal Insurance Contributions Act.” So FICA is nothing more than the tax provisions of the Social Security Act, as they appear in the Internal Revenue Code.

Q18: Is there any significance to the numbers assigned in the Social Security Number?

A: Yes. Originally, the first three digits are assigned by the geographical region in which the person was residing at the time he/she obtained a number. Generally, numbers were assigned beginning in the northeast and moving westward. So people on the east coast have the lowest numbers and those on the west coast have the highest numbers. The remaining six digits in the number are more or less randomly assigned and were organized to facilitate the early manual bookkeeping operations associated with the creation of Social Security in the 1930s.

Beginning on June 25, 2011, the SSA implemented a new assignment methodology for Social Security Numbers. The project is a forward looking initiative of the Social Security Administration (SSA) to help protect the integrity of the SSN by establishing a new randomized assignment methodology. SSN Randomization will also extend the longevity of the nine-digit SSN nationwide.

For more information on the randomization of Social Security Numbers, please visit this website:

http://ssa.gov/employer/randomizationfaqs.html#a0=-1

Q19: How many Social Security numbers have been issued since the program started?

A: Social Security numbers were first issued in November 1936. To date, 453.7 million different numbers have been issued.

Q20: Are Social Security numbers reused after a person dies?

A:  No. We do not reassign a Social Security number (SSN) after the number holder’s death. Even though we have issued over 453 million SSNs so far, and we assign about 5 and one-half million new numbers a year, the current numbering system will provide us with enough new numbers for several generations into the future with no changes in the numbering system.

Q21: When did Social Security cards bear the legend “NOT FOR IDENTIFICATION”?

A: The first Social Security cards were issued starting in 1936, they did not have this legend. Beginning with the sixth design version of the card, issued starting in 1946, SSA added a legend to the bottom of the card reading “FOR SOCIAL SECURITY PURPOSES — NOT FOR IDENTIFICATION.” This legend was removed as part of the design changes for the 18th version of the card, issued beginning in 1972. The legend has not been on any new cards issued since 1972.

Q22: Does the Social Security Number contain a code indicating the racial group to which the cardholder belongs?

A: No. This is a myth. The Social Security Number does contain a segment (the two middle numbers) known as “the group number.” But this refers only to the numerical groups 01-99. It has nothing to do with race.

More detailed information on the Group Number:

Apparently due to the fact that the middle digits of the SSN are referred to as the “group number,” some people have misconstrued this to mean that the “group number” refers to racial groupings. So a myth goes around from time-to-time that encoded in a person’s SSN is a key to their race. This simply is not true.

As should be clear from the explanation of the SSN numbering scheme, the “group number” refers only to the numerical groups 01-99. For filing purposes, the “area numbers” are broken down into these numerical subgroups. So, for example, for area numbers starting with 527 there would be 99 subgroups, one for every number starting with 527-01, and one for every number starting with 527-02, and so on. This was done back in 1936 because in that era there were no computers and all the records were stored in filing cabinets. The early program administrators needed some way to organize the filing cabinets into sub-groups, to make them more manageable, and this is the scheme they came up with.

So the “group number” has nothing whatever to do with race.

More detailed information on the Numbering Scheme:

Number Has Three Parts

The nine-digit SSN is composed of three parts:

  • The first set of three digits is called the Area Number
  • The second set of two digits is called the Group Number
  • The final set of four digits is the Serial Number

The Area Number

The Area Number is assigned by the geographical region. Prior to 1972, cards were issued in local Social Security offices around the country and the Area Number represented the State in which the card was issued. This did not necessarily have to be the State where the applicant lived, since a person could apply for their card in any Social Security office. Since 1972, when SSA began assigning SSNs and issuing cards centrally from Baltimore, the area number assigned has been based on the ZIP code in the mailing address provided on the application for the original Social Security card. The applicant’s mailing address does not have to be the same as their place of residence. Thus, the Area Number does not necessarily represent the State of residence of the applicant, either prior to 1972 or since.

Generally, numbers were assigned beginning in the northeast and moving westward. So people on the east coast have the lowest numbers and those on the west coast have the highest numbers.

Note: One should not make too much of the “geographical code.” It is not meant to be any kind of useable geographical information. The numbering scheme was designed in 1936 (before computers) to make it easier for SSA to store the applications in our files in Baltimore since the files were organized by regions as well as alphabetically. It was really just a bookkeeping device for our own internal use and was never intended to be anything more than that.

Group Number

Within each area, the group number (middle two (2) digits) range from 01 to 99 but are not assigned in consecutive order. For administrative reasons, group numbers issued first consist of the ODD numbers from 01 through 09 and then EVEN numbers from 10 through 98, within each area number allocated to a State. After all numbers in group 98 of a particular area have been issued, the EVEN Groups 02 through 08 are used, followed by ODD Groups 11 through 99.

Serial Number

Within each group, the serial numbers (last four (4) digits) run consecutively from 0001 through 9999.

Q23: Has Social Security ever been financed by general tax revenues?

A: Not to any significant extent.

Detailed explanation of the Design of the Original Social Security Act:

The new social insurance program the Committee on Economic Security (CES) was designing in 1934 was different than welfare in that it was a contributory program in which workers and their employers paid for the cost of the benefits–with the government’s role being that of the fund’s administrator, rather than its payer. This was very important to President Roosevelt who signaled early on that he did not want the federal government to subsidize the program–that it was to be “self-supporting.” He would eventually observe: “If I have anything to say about it, it will always be contributed, both on the part of the employer and the employee, on a sound actuarial basis. It means no money out of the Treasury.”

But some members of the CES did not understand “self-supporting” with quite the same purity as the President did. They saw no reason why general revenues could not be used– especially in the context of the overall approach to old-age security. FDR, and the members of the CES, believed that old-age assistance was a temporary stop-gap which would eventually completely disappear as social insurance became established. At a November 27, 1934 meeting the staff displayed a large wall-chart showing two trend lines, one for old-age assistance and one for the social insurance program. The line for old-age assistance was heading down while that for social insurance was heading up. At the point where they intersected, social insurance would have assumed the bulk of the burden of providing old-age security in America. Thus, general revenue expenses for old-age assistance would steadily diminish, thanks to Social Security. The staff reasoned that it was sensible to take a portion of this savings and use it to finance the Social Security program in the out-years–thus keeping payroll tax rates lower than they otherwise would have to be. Using this rationale, the CES proposal presented to FDR contained a tax schedule which financed the program by payroll taxes until 1965, at which point a general revenue subsidy would kick-in. Eventually, under the CES plan, general revenues would finance about one-third of the cost of the benefits.

The Committee’s report was late. It was due to Congress on January 1, 1935 but it was not finished and presented to the President until January 15th. Immediately upon receiving the report the President sent notice to Congress that he would be transmitting the report to them on the 17th, then he sat down to read the report. FDR very carefully went over the actuarial tables and discovered to his surprise that the program was not fully “self- supporting” as he had directed it should be. He summoned Secretary Perkins to the White House on the afternoon of the 16th to tell her that there must be some mistake in the actuarial tables because they showed a large federal subsidy beginning in 1965. When informed that this was no mistake, the President made it clear it was indeed a mistake, although of a different kind! He told the Secretary to get to work immediately to devise a fully self-sustaining old age insurance system. The report was transmitted to the Congress on the 17th as the President had promised, but the actuarial table in question was withdrawn until it could be reworked. Bob Myers, later to be SSA’s Chief Actuary, was given the assignment to rework the financing and the system finally devised projected a $47 billion surplus by 1980–with no general revenue financing.

Detailed explanation of the Beginning of Small General Revenue Subsidies:

And so, Social Security was from its first day of operation a fully self-supporting program, without any general revenue funding. But FDR’s sense of purity was ultimately left behind when Congress voted the first subsidy provisions to be added to Social Security. Ever since World War II it was recognized that there was a problem for people who entered the service of their country in the military. Immediately following World War II Congress passed a brief change to Social Security which provided some small general revenues to pay benefits to WWII veterans who had become disabled in the years immediately following the War and who did not qualify for a veterans benefit. From 1947-1951 a total of $16 million was transferred into the Trust Funds for this purpose.

Since military wages were not covered employment until 1957, spending several years in the military would result in reduced Social Security benefits. Even after military service became a form of covered employment, the low cash wages paid to servicemen and women meant that military service was also a financial sacrifice. As a special benefit for members of the armed forces the Congress decided to grant special non-contributory wage credits for military service before 1957 and special deemed military wage credits to boost the amounts of credited contributions for service after 1956. These credits were paid out of general revenues as a subsidy to military personnel. So, each year since 1966 the Social Security Trust Funds have in fact received some relatively small transfers from the general revenues as bonuses for military personnel.

In 1965-66 Congress also identified another “disadvantaged” group: elderly individuals (age 72 before 1971) who had not been able to work long enough under Social Security to become insured for a benefit. People in this group were granted special Social Security benefits paid for entirely by the general revenues of the Treasury. These were known as Special Age 72, or Prouty, benefits. Over time, of course, these beneficiaries will disappear as Father Time claims members of the group.

Finally, as part of the 1983 Amendments, Social Security benefits became subject to federal income taxes for the first time, and the monies generated by this taxation are returned to the Trust Funds from general revenues–the third and last source of general revenue financing of Social Security.

All three of these general revenue streams are so small relative to the payroll tax funding that for most practical purposes we could still accurately describe the Social Security program as “self-supporting.”

Q24: How much has Social Security paid out since it started?

A: From 1937 (when the first payments were made) through 2009 the Social Security program has expended $11.3 trillion.

Q25: How much has Social Security taken in taxes and other income since it started?

A: From 1937 (when taxes were first collected) through 2009 the Social Security program has received $13.8 trillion in income.

Q26: Has Social Security always taken in more money each year than it needed to pay benefits?

A: No. So far there have been 11 years in which the Social Security program did not take enough in FICA taxes to pay the current year’s benefits. During these years, Trust Fund bonds in the amount of about $24 billion made up the difference.

Q27: Do the Social Security Trust Funds earn interest?

A: Yes they do. By law, the assets of the Social Security program must be invested in securities guaranteed as to both principal and interest. The Trust Funds hold a mix of short-term and long-term government bonds. The Trust Funds can hold both regular Treasury securities and “special obligation” securities issued only to federal trust funds. In practice, most of the securities in the Social Security Trust Funds are of the “special obligation” type. (See additional explanation from SSA’s Office of the Actuary.)

The Trust Funds earn interest which is set at the average market yield on long-term Treasury securities. Interest earnings on the invested assets of the combined OASI and DI Trust Funds were $55.5 billion in calendar year 1999. This represented an effective annual interest rate of 6.9 percent.

The Trust Funds have earned interest in every year since the program began. More detailed information on the Trust Fund investments can be found in the Annual Report of the Social Security Trustees and on the Actuary’s webpages concerning the Investment Transactions and Investment Holdings of the Trust Funds.

Q28: Did President Franklin Roosevelt make a set of promises about Social Security, which have now been violated?

A: This question generally refers to a set of misinformation that is propagated over the Internet (usually via email) from time to time.

More details about Myths:

Myth 1: President Roosevelt promised that participation in the program would be completely voluntary

Persons working in employment covered by Social Security are subject to the FICA payroll tax. Like all taxes, this has never been voluntary. From the first days of the program to the present, anyone working on a job covered by Social Security has been obligated to pay their payroll taxes.

In the early years of the program, however, only about half the jobs in the economy were covered by Social Security. Thus one could work in non-covered employment and not have to pay FICA taxes (and of course, one would not be eligible to collect a future Social Security benefit). In that indirect sense, participation in Social Security was voluntary. However, if a job was covered, or became covered by subsequent law, then if a person worked at that job, participation in Social Security was mandatory.

There have only been a handful of exceptions to this rule, generally involving persons working for state/local governments. Under certain conditions, employees of state/local governments have been able to voluntarily choose to have their employment covered or not covered.

Myth 2: President Roosevelt promised that the participants would only have to pay 1% of the first $1,400 of their annual incomes into the program

The tax rate in the original 1935 law was 1% each on the employer and the employee, on the first $3,000 of earnings. This rate was increased on a regular schedule in four steps so that by 1949 the rate would be 3% each on the first $3,000. The figure was never $,1400, and the rate was never fixed for all time at 1%.

(The text of the 1935 law and the tax rate schedule can be found here.)

Myth 3: President Roosevelt promised that the money the participants elected to put into the program would be deductible from their income for tax purposes each year

There was never any provision of law making the Social Security taxes paid by employees deductible for income tax purposes. In fact, the 1935 law expressly forbid this idea, in Section 803 of Title VIII.

(The text of Title VIII. can be found here.)

Myth 4: President Roosevelt promised that the money the participants paid would be put into the independent “Trust Fund,” rather than into the General operating fund, and therefore, would only be used to fund the Social Security Retirement program, and no other Government program

The idea here is basically correct. However, this statement is usually joined to a second statement to the effect that this principle was violated by subsequent Administrations. However, there has never been any change in the way the Social Security program is financed or the way that Social Security payroll taxes are used by the federal government.

The Social Security Trust Fund was created in 1939 as part of the Amendments enacted in that year. From its inception, the Trust Fund has always worked the same way. The Social Security Trust Fund has never been “put into the general fund of the government.”

Most likely this myth comes from a confusion between the financing of the Social Security program and the way the Social Security Trust Fund is treated in federal budget accounting. Starting in 1969 (due to action by the Johnson Administration in 1968) the transactions to the Trust Fund were included in what is known as the “unified budget.” This means that every function of the federal government is included in a single budget. This is sometimes described by saying that the Social Security Trust Funds are “on-budget.” This budget treatment of the Social Security Trust Fund continued until 1990 when the Trust Funds were again taken “off-budget.” This means only that they are shown as a separate account in the federal budget. But whether the Trust Funds are “on-budget” or “off-budget” is primarily a question of accounting practices–it has no affect on the actual operations of the Trust Fund itself.

Myth 5: President Roosevelt promised that the annuity payments to the retirees would never be taxed as income

Originally, Social Security benefits were not taxable income. This was not, however, a provision of the law, nor anything that President Roosevelt did or could have “promised.” It was the result of a series of administrative rulings issued by the Treasury Department in the early years of the program. (The Treasury rulings can be found here.)

In 1983 Congress changed the law by specifically authorizing the taxation of Social Security benefits. This was part of the 1983 Amendments, and this law overrode the earlier administrative rulings from the Treasury Department. (A detailed explanation of the 1983 Amendments can be found here.)

Q29: I have seen a set of questions and answers on the Internet concerning who started the taxing of Social Security benefits, and questions like that. Are the answers given correct?

A: There are many varieties of questions and answers of this form circulating on the Internet. One fairly widespread form of the questions is filled with misinformation. (See a detailed explanation here.) We recommend that Internet users refer to SSA’s official Questions and Answers section on our homepage for reliable information (go to www.socialsecurity.gov for the Q & A section.)

Effects Of Unauthorized Immigration On The Actuarial Status Of The Social Security Trust Funds

This actuarial note provides information related to projections of the effects of unauthorized immigrants on the U.S. labor force, and more specifically on the actuarial status of the Social Security (OASI and DI) Trust Funds. We have been modeling this important, yet elusive, population for many years.

We reported on these effects in a letter to Illinois Senator Dick Durbin in 2007. The nature and characteristics of this population have changed over the last decade and so we have modified our methods to better account for work activity and potential benefit receipt by unauthorized immigrants. All estimates and analysis reflect the intermediate assumptions and methods developed for the 2012 Trustees Reports.

The balance of this note provides:

  • A brief review of the nature of unauthorized immigration, how it has changed, and how our modeling has evolved;
  • A detailed discussion of the effects of unauthorized immigration on Social Security’s actuarial status;
  • Answers to some important questions regarding undocumented immigrants; and
  • A list of the major laws affecting both unauthorized immigrants and Social Security.

A Brief Review of Unauthorized Immigration

Legal immigration into the United States has been a major source of population growth and diversity. For over a century, legal immigration has been regulated and the numbers of legal immigrants have been limited by a succession of laws. Unauthorized immigration into the U.S. results from entering the country without legal authorization and from overstaying temporary visas. Both forms of immigration have contributed substantially to the population, directly and indirectly. The indirect contribution refers to the fact that children born in the U.S. to these immigrants are U.S. citizens. For the purpose of this discussion, we use the following terms:

  • Legal immigrants – U.S. residents born outside the U.S. who have been granted legal permanent resident (LPR) status or have become naturalized citizens.
  • Other immigrants – U.S. residents born outside the U.S. who have not attained LPR status or citizenship (this group includes those with temporary legal visas).
  • Unauthorized immigrants – Other immigrants residing in the U.S. without current papers documenting their legal status (i.e., either they entered the U.S. without legal documentation or they overstayed temporary visas).
  • Unauthorized workers – Other immigrants working in the U.S. without current visas granting them authorization to work.

In the beginning of 1989, there were an estimated 5 million unauthorized immigrants in the U.S. The Immigration Reform and Control Act of 1986 (IRCA) allowed unauthorized immigrants who could prove they had been residing here for 5 years to apply for LPR status. From 1989 through 1991, about half of these unauthorized immigrants were granted LPR status under IRCA. Since the mid 1990’s, however, the estimated number of persons entering the U.S. without authorization has averaged over 1 million per year, and the estimated number of unauthorized immigrants now totals more than 10 million. Individuals leave unauthorized status both by leaving the U.S. (emigration) and by applying for, and being granted, LPR status. In fact, about half of the individuals granted LPR status each year are estimated to come from the other immigrant population. Most of these individuals are residing as temporary legal immigrants with visas or have overstayed visas, rather than coming from the population that has never had temporary legal status.

In 2008, the Office of the Chief Actuary (OCACT) completely restructured the projection method for the other immigrant population. This restructuring had two objectives. The first was to model separately the annual flows of individuals: (1) entering the country in other immigrant status; (2) converting from other immigrant status to LPR status; and (3) leaving the U.S. from the other immigrant population. The second objective was to reflect administrative changes made by the Social Security Administration (SSA) since 2001, which made it more difficult for unauthorized immigrants to obtain Social Security numbers (SSN) through illegitimate means. Since 2001, SSA greatly increased scrutiny of applications for an SSN after birth, which reduced the incidence of illegitimate receipt of an SSN. For other immigrants entering the U.S. in 2001 and earlier, we assume that about one-third attained apparently legitimate SSNs through illegitimate means. For unauthorized immigrants entering the country after 2001, we believe that the granting of SSNs based on illegitimate documentation has been greatly reduced.

Laws enacted in 1996 and 2004 make Social Security benefits unavailable to unauthorized immigrants residing in the U.S. and to any noncitizen without a workauthorized SSN at some point in time. We project that these laws will significantly reduce benefit receipt among persons who remain in the unauthorized immigrant population in the future.

How The Participation Of Unauthorized Workers Affects Social Secuirty’s Financial Position

For the annual Trustees Reports, the President’s Budget, and other documents, OCACT projects the numbers of unauthorized immigrants residing in the United States, their earnings, and the implications of these earnings on Social Security financing. Our projections assume that unauthorized residents work at about the same rate as the rest of the population by age and sex, but earnings are less likely to be reported as taxable and even less likely to be credited for future benefit entitlement. Thus, our projections suggest that the presence of unauthorized workers in the United States has, on average, a positive effect on the financial status of the Social Security program. For the year 2010,1 we estimate that the excess of tax revenue paid to the Trust Funds over benefits paid from these funds based on earnings of unauthorized workers is about $12 billion.

While we cannot determine the precise effect on Social Security financing of earnings of unauthorized immigrants, program data fully capture this effect. The current overall financial status of the Social Security Trust Funds is well known, and it provides an excellent base upon which to make projections for the future. The difficulty lies in determining what portion of total taxes paid to and benefits received from the Social Security Trust Funds derive from the earnings of these immigrants. We can only estimate these amounts using the best available information.

Beyond the taxes paid and benefits received by unauthorized workers, the larger effect on the long-term actuarial status of the OASDI Trust Funds derives from the children born in the U.S. to these immigrants. These children are natural born citizens and add to the growth in the overall U.S. population. This contribution to future generations of workers is the largest part of the effect on the actuarial status both for legal and other immigrants.

Earnings of Unauthorized Immigrants in the United States

The Census Bureau estimates that the number of people living in the U.S. who were foreign born and not U.S. citizens was 21.7 million in January 2009. Of these, 12.6 million individuals were not legal permanent residents of the U.S. We refer to this group as other immigrants (other than legal permanent resident immigrants). Of this number, about 10.8 million resided in the U.S. in an unauthorized status. The remaining other immigrants resided in the U.S. in a temporary authorized status (for example students and workers with temporary visas).

In order to make projections of the financial status of the Social Security program, OCACT projects the number of other immigrants who are working under various classifications. OCACT assumes that other immigrants are as likely to work as legal permanent residents of the same age and sex. The estimated number of other immigrants working is 8.3 million in 2010. OCACT estimates 0.6 million of the 8.3 million other immigrant workers in 2010 had temporary work authorized at some point in the past and have overstayed the term of their visas. In addition, OCACT estimates that 0.7 million unauthorized workers in 2010 obtained fraudulent birth certificates at some point in the past and these birth certificates allowed the workers to get an SSN. Combining these two groups with the 1.3 million current visa holders with temporary authorization, we estimate 2.7 million other immigrants have SSNs in their name and thus can work, pay taxes, and have earnings credited to their record for potential benefits in the future.

OCACT estimates 1.8 million other immigrants worked and used an SSN that did not match their name in 2010. Their earnings may be credited to someone else’s record (when the SSN and name submitted to the employer match Social Security records) or may be credited to the Earnings Suspense File (when submitted with nonmatching SSN and name). Finally, OCACT estimates 3.9 million other immigrants worked in the underground economy in 2010.

Eliminating the current visa holders with temporary authorization (1.3 million other immigrants with legal work authorization), and those in the underground economy (3.9 million unauthorized workers), we estimate that there are about 3.1 million unauthorized immigrants working and paying Social Security taxes in 2010. With the average amount of OASDI taxable earnings for these immigrants assumed to be about 80 percent of the average level for all workers, we estimate $13 billion in payroll taxes from unauthorized immigrant workers and their employers in 2010.

Benefits Based on Earnings by Unauthorized Immigrants

Estimating the portion of all 2010 OASDI benefit payments that will be based on prior unauthorized earnings is even more problematic than estimating current unauthorized earnings. In general, we believe that the evidence indicates a relatively small portion of those who potentially could draw benefits do so.

The principal category of unauthorized immigrants who can currently draw a Social Security benefit includes those who have overstayed visas, or obtained an SSN through illegitimate means. For January 1, 2010, we estimate that there were 720 thousand other immigrants aged 62 and over. Assuming: (1) about 25 percent of these immigrants meet the insured requirements and have a functional SSN matching their name; and (2) they have a monthly benefit level about half the average, we estimate about 180 thousand beneficiaries received roughly $1 billion in benefits in 2010.

Three additional categories of workers account for a relatively small amount of the total OASDI benefit payments. First, individuals who began receiving benefits before 1997 and never obtained authorization to work, could potentially be receiving benefits. However, they met the difficult challenge of documenting their past earnings and establishing the earnings as taxable. Second, individuals who never obtained authorization to work, received an SSN before 2004, and now live abroad could potentially receive a benefit. However, they would have similar challenges in documenting past earnings. Third, individuals who currently have authorization to work but did not have authorization while residing here in the past would find it difficult to document the earlier earnings. In each of these cases, the requirement to document ownership of reported taxable earnings in the past is a high hurdle, and meeting this requirement seems to be more the exception than the rule.

Overall, therefore, we estimate that about $1 billion of OASDI benefit payments for 2010 derive from earnings in years where the worker was unauthorized.

Conclusion

While unauthorized immigrants worked and contributed as much as $13 billion in payroll taxes to the OASDI program in 2010, only about $1 billion in benefit payments during 2010 are attributable to unauthorized work. Thus, we estimate that earnings by unauthorized immigrants result in a net positive effect on Social Security financial status generally, and that this effect contributed roughly $12 billion to the cash flow of the program for 2010. We estimate that future years will experience a continuation of this positive impact on the trust funds.

While we expect the size of the unauthorized population to grow further in the future, several changes would limit the reporting of their earnings as taxable. Among these are issuance of SSNs at birth in recent years and greater scrutiny of birth certificates for individuals who only apply for SSNs at working ages. In addition, recent legislation requires that other immigrants receiving an SSN after 2003 cannot receive benefits unless the worker had legal work authorization at some point before retiring. Another recent change is the creation of a national-wide earnings verification system, which allows employers to check the legal status of their employees. While these changes will alter the future impact of earnings by unauthorized immigrants on the trust funds, we still expect significant effects that will benefit the financial status of the programs.

Answers To Specific Questions On Unauthorized Immigration

Question: To what extent has the economic downturn (that began in 2007) changed immigration trends in the U.S.?

Response: The economic downturn did not affect the number of persons attaining legal immigrant status, as there are always more applicants than can be allowed under the legal limits. However, the downturn did affect the numbers of other immigrants entering and leaving the country. For the intermediate projection of the 2008 Trustees Report (these projections did not include the downturn), we assumed 1.5 million other immigrants would enter the country in 2009. We now estimate that about 700 thousand other immigrants entered the country in 2009. In addition, due to the recession, we estimate that the number of other immigrants leaving the country was elevated in 2009, leaving only 40,000 net other immigrants for the year. We expect the effects of the recession on the number of other immigrants entering and leaving the country to be temporary. For 2015, we expect the number entering the country to return to 1.5 million and the net other immigration to be about 500,000.

Question: What is the total number of unauthorized workers now participating in the U.S. economy? How has this number changed in the past and how will it change in the future?

Response: We estimate that the number of unauthorized workers grew from 4.8 million in 2000 to 8.0 million in 2007, the peak of the last business cycle. The economy then fell into recession and the estimated number of unauthorized workers declined to 7.0 million in 2010. We project that the economy will recover and that the number of unauthorized workers will rise to 9.6 million in 2020.

Question: What is the number of workers who are entering the country illegally? What is the number of workers who have overstayed their visas? How have these numbers changed?

Response: The number of persons residing in the country without current legal authorization grew during the period 1990 to 2006 and the Department of Homeland Security (DHS) estimated the stock of unauthorized immigrants to be 11.8 million as of January 1, 2007. However, DHS estimated that this number declined to 10.8 million as of January 1, 2009. After the recovery from the recession, we assume the annual number of other immigrants (unauthorized and temporary visas) entering the U.S. will be 1.5 million per year. However, we assume that about one-third of those entering the country (largely those who have temporary visas or overstay temporary visas) will gain LPR status within a few years, and that the majority of the remaining 1 million other immigrants will eventually leave the country. We estimate the number of other immigrants who have entered the country legally with a temporary visa, have overstayed their visa (work or student), and are working using their legitimately acquired SSN to be 0.6 million in 2010, slightly above the 2000 level of 0.5 million.

Question: How many of the unauthorized workers have an SSN issued in their name and how many are reporting earnings under invalid numbers?

Response: Before 1980, many unauthorized workers obtained SSNs in their name using fraudulent identification, particularly birth certificates. After 2001, however, SSA became far more vigilant on identification, and the number of persons obtaining SSNs with fraudulent identification should now be relatively small. We estimate 0.7 million unauthorized workers in 2010 were working using fraudulent identification (most with SSNs obtained before 2001), and we project this number to decrease to less than 0.2 million in 2040. Increasingly in the future, earnings reported to SSA for unauthorized workers will be reported with an illegitimate SSN. In this case, the reported earnings show up with a mismatch between name and SSN and thus would be assigned to the Earnings Suspense File. Due to this mismatch, the worker (and employer) would be paying payroll taxes, but the earnings would not be credited toward later receipt of benefits. Our estimate for the current stock of these immigrants is 1.8 million in 2010, rising to 3.4 million by 2040.

Question: How many unauthorized workers are employed in the underground economy? How has this number changed in the past and how will it change in the future?

Response: The estimated number of unauthorized workers who are employed in the underground economy grew from 2.2 million in 2000 to 3.9 million in 2010. We project the number of these workers to grow to 9.0 million in 2040.

Wage reporting and wage levels

Question: Of the unauthorized workers paying OASDI taxes, what is the average level of earnings upon which the taxes are levied and how does that level compare with the broader U.S. labor force?

Response: We assume the average level of taxable earnings for these unauthorized workers equals about 80 percent of the average level for all workers. For 2010, we estimate this average level for these unauthorized workers to be about $34,000.

Question: What is the dollar amount of payroll taxes paid by unauthorized workers and their employers for the latest tax year?

Response: We estimate $13 billion in OASDI payroll taxes from unauthorized immigrant workers and their employers in 2010. This number reflects earnings for those with no recorded SSN, those who have obtained an SSN with fraudulent identification, and those with legitimate SSNs who have overstayed temporary visas.

Question: Does information in the Social Security Earnings Suspense File (ESF) provide insights into unauthorized workers’ labor force participation and earnings? What dollar amount or percentage of earnings in the ESF is the result of unauthorized work? How many items posted to the ESF are from unauthorized work? Since both legal and illegal workers may hold several jobs in any tax reporting year, how does that affect the estimate of unauthorized wage items and earnings reported by unauthorized workers?

Response: Viewing the history of the ESF, we attempt to separate the total dollar amount of taxable wages for each year between unauthorized workers and the rest of the population. However, because we cannot identify which individual “wage items” are for unauthorized immigrants and which are for legal residents, we have no way to determine specifically either the number of wage items reported per worker or the average total annual earnings per worker represented on the ESF. Historically, both the unauthorized population and the percent of total reported earnings that goes to the ESF have been rising and we estimate a continuation of these trends. We estimate earnings in the ESF for unauthorized immigrants will increase from less than 1 percent of total taxable payroll in 2000 to about 2 percent in 2040.

Benefits based on earnings by unauthorized workers

Question: How many unauthorized workers receive benefits from Social Security? How many fall under the category of overstayed visa or an SSN obtained through illegitimate means? What is their benefit level, their insured status, and the total amount of benefits they receive compared to authorized workers? What are the trends over time? How will these trends change in the future?

Response: Individuals who enter the country as unauthorized immigrants and remain in that status for life are relatively unlikely to receive benefits from the OASDI program. Those who work in the underground economy have no basis for expecting to be entitled for benefits. Those who have worked and paid payroll taxes without a matched SSN will have had their earnings placed in the suspense file and will have only a relatively remote possibility of obtaining credit for these earnings for the purpose of becoming entitled to a benefit. The relatively small and declining number of unauthorized immigrants who have an SSN with earnings credited in their name, may receive benefits in the future. However, to receive benefits they must meet the following three conditions: (1) work long enough to acquire insured status under the program; (2) receive legal work authorization at some time; and (3) receive legal resident status for the time of their benefit entitlement or, if not, are willing to leave the U.S. to receive a benefit.

Question: What categories of persons, who are or were unauthorized workers, may be eligible for benefits if they can document past earnings? To what degree are they successful in documenting such earnings?

Response: We estimate about 30 percent of the other immigrants who were living in the U.S. and were age 62 in 2000, would be eligible to receive retired-worker benefits. We project that the percent eligible to receive a retired-worker benefit will decline to around 10 percent at the end of the 75- year projection period. In addition, SSA authorized about 0.5 million checks to persons living abroad in December 2010. However, most of these individuals are U.S. citizens living abroad or persons receiving benefits under totalization agreements with other countries (based on authorized work).

Major Laws Affecting Unauthorized Immigration And Social Security

Immigration Reform and Control Act (IRCA) of 1986 allowed about ½ of the undocumented population in 1987 to become legal permanent residents over the period 1989-1991.

Effective December 1, 1996, the Illegal Immigration Reform and Immigrant Responsibility Act of 1996 prohibits SSA from paying monthly Title II benefits to noncitizens who are in the United States for any month during which they are not lawfully authorized to be in the country. After 2000, SSA became more vigilant in issuing SSNs. Since September 2002, SSA verifies noncitizens’ immigration status with the Department of Homeland Security (DHS) before assigning an original SSN or issuing a replacement SSN card.

The Social Security Protection Act of 2004 restricts SSA from authorizing Title II benefits to noncitizen workers who received an original Social Security number (SSN) after January 1, 2004 unless they were issued an SSN for work purposes or were admitted into the United States as a nonimmigrant visitor for business or as an alien crewman.

The original report can be found here.

Entitlements Hysteria

One of the unshakable myths of the punditariat is that the federal government is going bankrupt because of entitlements spending, especially spending on Medicare and Medicaid. Each day we hear the drumbeat saying that either we cut entitlements now or we are finished as a nation. This is a stampede of unreason, contradicted by the facts.

Look at the new budget released at the beginning of the week. Table S-6 on page 212 is the operative page. According to the President’s budget, Medicare and Medicaid would rise slightly from 5.1 percent of GDP in 2011 to 5.5 percent of GDP in 2020. Not exactly the stuff of deficit cataclysm.

So what is the source of the hysteria? Some of it is simply propaganda, by those with the political agenda to gut the country’s social safety net.

But there is something else. Confusion! The punditocracy is repeating the results of forecasts that indeed suggest calamity, but calamity in the late 21st century, not now. These long-term forecasts are arbitrary but have been repeated as an immutable fact by those who don’t read the fine print. The most frequently quoted forecast is that of the Congressional Budget Office.

The CBO’s long-term forecast assumes that health care costs will continue to rise steeply during the next 70 years, though at a diminishing rate. If healthcare costs continue to soar for decades to come, then yes, lo-and-behold, the government would eventually go broke. Federal spending on health care would reach around 25 percent of GNP in 2085.

Yet somehow I’m not ready to panic about the health care costs as of 2085. Mechanical extrapolations that assume that health care costs will rise much faster than GNP between 2011 and 2085 are utterly unconvincing. Why should healthcare costs continue to rise so far and fast when healthcare costs are already vastly over-priced now compared with what other countries pay for the same services? Why should we assume failure decade after decade to use the new information technologies to lower the costs of health-care delivery and administration?

In fact, the recent trends are mildly favorable. As J. D. Keinke of the American Enterprise Institute writes today in the Wall Street Journal, the idea of runaway health spending is a “myth” because “new data show that health spending over the past several years has been normalizing toward the rate of general inflation, rather than growing higher and higher, as had been the case almost continuously since the 1970s.”

Public outrage and market pressures are gradually prevailing over the health-care lobby. American households will ultimately get the care they need much nearer to the lower prices that most other countries pay. Even if we don’t get all the way down to the lower costs that we should have, there is no reason to assume that health care costs will continue to soar year in and year out for another seven decades.

Let’s therefore fight the… hysteria demanding immediate and harsh cuts in Medicaid and other health outlays. We do not need to cut off the lifeline of the poor and elderly. We simply need to keep up the pressure against the healthcare lobbies, and resist the panic of the punditariat