Tag: Trade

NAFTA’s Legacy: Expanding Corporate Power To Attack Public Interests Laws And Outsource Jobs

At the heart of the North American Free Trade Agreement (NAFTA) is a stunning corporate power grab: NAFTA grants rights to thousands of multinational corporations to bypass domestic courts and directly “sue” the U.S., Canadian and Mexican governments before a panel of three corporate lawyers.

These lawyers can award the corporations unlimited sums to be paid by taxpayers, including for the loss of expected future profits. These corporations need only convince the lawyers that a domestic law, safety regulation or court ruling – that we rely on for a clean environment, essential services and healthy communities – violates the new rights and privileges NAFTA grants to them. The corporate lawyers’ decisions are not subject to outside appeal.

How could multinational corporations attack domestic health, environmental and financial protections on which we all rely and that local companies have to follow?

NAFTA and other corporate-rigged deals include terms formally known as Investor-State Dispute Settlement (ISDS). ISDS gives multinational corporations stunning powers, including the ability to challenge new policies – from Wall Street regulations to climate change protections – if corporations claim these policies violate their NAFTA rights and frustrate the corporations’ “expectations” of how they should be treated.

If an ISDS tribunal of three corporate lawyers rules against a challenged policy, there is no limit to the amount of taxpayer money a government can be ordered to pay a corporation. The amount is based on the “expected future profits” the tribunal surmises that the firm would have earned in the absence of the policy it is attacking. The number of ISDS attacks launched each year has exploded in recent years and the variety of policies being attacked is expanding.

Conflicts of Interest

NAFTA allows the lawyers on these tribunals to rotate between serving as “judges” and bringing cases for corporations against governments – a conflict of interest that would be forbidden as highly unethical under most legal systems. These “tribunalists,” as the three private sector attorneys are formally called, are not bound by precedent or the opinions of governments about what an agreement means. And there is no outside appeal to their rulings. If governments do not pay, the corporations can seize government property or assets directly to make up the ordered amount.

If that were not sufficiently outrageous, these special protections for multinational corporations also incentivize job offshoring. These corporate rights and powers eliminate many of the usual costs and risks that make firms think twice about moving to low-wage countries, literally incentivizing corporations to launch a new wave of job offshoring.

While this shadow legal system for multinational corporations has been around since the 1950s, just 50 known cases were launched in the regime’s first three decades combined. In contrast, corporations have launched approximately 50 claims in each of the last six years. ISDS is now so controversial that some governments have begun terminating their treaties that include ISDS.

NAFTA Cases Target Health and Environmental Policies

More than $392 million in compensation has already been paid out to corporations in a series of investor-state cases under NAFTA. This includes attacks on oil, gas, water and timber policies, toxics bans, health and safety measures, and more. In fact, of the 11 claims (for more than $36 billion) currently pending under NAFTA, nearly all relate to environmental, energy, financial, public health, land use and transportation policies – not traditional trade issues.

Here are just some examples of the overreach of the ISDS system under NAFTA.

The Investor Wins Taxpayer Compensation via Tribunal Order

Bilcon v. Canada: A NAFTA ISDS tribunal ruled in favor of a company that planned to blast a basalt quarry and marine terminal in an environmentally-sensitive area in Nova Scotia, deciding that the impact assessment that had been ordered by Canada’s Department of Fisheries and Oceans was a violation of the company’s NAFTA rights. A dissenting tribunalist called the decision “a remarkable step backwards in environmental protection.” But the Canadian government was ordered to pay more than $100 million to the firm.

Mobil / Murphy Oil v. Canada: A NAFTA ISDS tribunal ruled in favor of U.S. oil corporations Mobil (of ExxonMobil) and Murphy Oil, deeming a Canadian province’s requirement that any firm—domestic or foreign— obtaining a drilling license must contribute a small share of oil revenue to fund research and development in Newfoundland and Labrador – one of Canada’s poorest provinces. The tribunal ruled this was a NAFTA-barred performance requirement and ordered the Canadian government to pay the firms $19 million.

Metalclad v. Mexico: A Mexican municipality’s refusal to grant U.S. firm Metalclad a construction permit, which it had also denied to the contaminated facility’s previous Mexican owner (until and unless the site was cleaned up), resulted in $15.6 million in compensation being paid by Mexico to the firm after one of NAFTA’s first ISDS rulings.

S.D. Myers v. Canada: A NAFTA ISDS tribunal ordered Canadian taxpayers to pay $5.6 million for a temporary Canadian ban on the export of a hazardous waste called polychlorinated biphenyls (PCB). Though the ban complied with a multilateral environmental treaty encouraging domestic treatment of toxic waste, the tribunal deemed it to be discriminatory and a violation of the corporation’s NAFTA right to a “minimum standard of treatment.”

The Investor Extracts Payment Through a Settlement

Ethyl v. Canada: The U.S. Ethyl Corporation used NAFTA’s investor-state system in the late 1990s to reverse a Canadian environmental ban of the carcinogenic gasoline additive MMT, also banned by numerous U.S. states, while also obtaining $13 million in compensation from the Canadian government to pay for revenue lost during the ban. Canada also was required to post advertisements in newspapers claiming the chemical was safe.

AbitibiBowater v. Canada: AbitibiBowater, a paper corporation, extracted a $123 million ISDS settlement after challenging the decision of Newfoundland and Labrador, a Canadian province, to take back various timber and water rights held by AbitibiBowater after the corporation closed a paper mill. The provincial government argued that under the terms of an agreement the firm had made with the province, which was working to save the mill that employed 800 people in a rural area, AbitibiBowater’s control of the forest lands and water rights were contingent on the company’s continued operation of the paper mill.

Pending Cases With Health and Environmental Implications

TransCanada v. United States: In June 2016, the TransCanada Corporation launched a NAFTA ISDS claim demanding $15 billion in compensation because the Canadian corporation’s bid to build a pipeline was rejected by the U.S. government. The company said it had invested $3 billion, but demanded the larger sum to pay for the future expected profits it would lose if the pipeline was not allowed to operate. The U.S. government decision not to approve the pipeline, because it was not in the national interest and would exacerbate climate change, came after years of government studies. Tens of thousands of citizens in the states that would be affected and environmental activists nationwide had worked for years to demonstrate that the pipeline would pose serious health and environmental risks. Even after President Trump announced he would reverse the Obama administration decision and allow the pipeline to proceed, TransCanada is proceeding with its ISDS case. Under NAFTA rules, it could be compensated for lost revenues and costs that resulted from a delay in the pipeline’s completion.

Lone Pine v. Canada In September 2013, Lone Pine Resources, a U.S.-based oil and gas exploration and production company, launched a $109 million NAFTA ISDS claim against Canada under NAFTA to challenge Quebec’s suspension of oil and gas exploration permits for deposits under the St. Lawrence River. The decision was part of a wider moratorium on the controversial practice of hydraulic fracturing, or fracking. The provincial government had declared a moratorium in 2011 so as to conduct an environmental impact assessment of the extraction method widely known for leaching chemicals and gases into groundwater and the air.

Eli Lilly v. Canada In September 2013, U.S. pharmaceutical giant Eli Lilly and Company, launched a $483 million NAFTA ISDS challenge after Canadian courts invalidated the firm’s patents for Strattera and Zyprexa, drugs used to treat attention deficit hyperactivity disorder, schizophrenia and bipolar disorder. In a case that greatly expands the scope of ISDS attacks, the firm is challenging Canada’s standard for issuing patents. Canadian federal courts ruled that Eli Lilly failed to meet the standards required to obtain a patent under Canadian law. Namely, the firm had failed to demonstrate or soundly predict that the drugs would provide the benefits that the firm promised when applying for the patents’ monopoly protection rights. The court’s decision paved the way for generic drug producers to make less expensive versions of the drugs. Eli Lilly is asking a NAFTA ISDS tribunal to second-guess not only the courts’ decisions, but Canada’s entire standard for issuing patents and determining their ongoing validity.

NAFTA ISDS Attacks Force Costly Defense of U.S. Policies

The U.S. government has spent tens of millions in legal costs to defend against NAFTA investor-state cases. But, thanks in part to technical errors by lawyers representing corporations in several cases, the United States has thus far dodged the bullet and avoided paying compensation. There have been 14 ISDS cases against U.S. policies–all by Canadian firms under NAFTA. A Columbia University Law School study shows that we have only narrowly escaped liability in some of these cases. For example, in the Loewen case, a NAFTA tribunal concluded that a Mississippi state Supreme Court decision that a Canadian funeral home conglomerate must follow normal civil procedure rules and post bond to appeal a contract dispute it had lost with a U.S. firm, violated NAFTA investor protections. Luckily for U.S. taxpayers, before compensation was ordered, the Canadian firm’s lawyers reincorporated the firm as a U.S. corporation under bankruptcy protection. This eliminated Loewen’s status (and privileges) as a foreign investor.

When U.S. state laws are challenged under the investor-state system, state governments have no standing and must rely on the federal government to defend their laws. If states are invited by federal officials to participate, they must pay their own legal expenses. California has incurred millions of dollars in legal costs helping to defend two state environmental laws – a toxics ban and a mining reclamation policy – that were challenged under NAFTA.

As corporations and law firms become emboldened and more creative, it is likely only a matter of time before U.S. taxpayers are on the hook, given that as long as NAFTA is in effect, more than 8,500 corporate subsidiaries from Canada and Mexico are empowered to use ISDS to challenge our policies.
Facing Up To Income Inequality

The Census Bureau recently announced a heartening 5 percent gain in the median household income between 2014 and 2015, the largest one-year gain on record. Yet a look at the longer-term trends offers a sobering perspective. The jump in household income merely helps to make up for lost ground; the median earnings in 2015 were actually lower than back in 1999 — 16 years ago.

While household median incomes have stagnated since the late 1990s, the inflation-adjusted earnings of poorer households have stagnated for even longer, roughly 40 years. Meanwhile, households at or near the top of the income distribution have enjoyed sizeable increases of living standards. The result is a stark widening of the gap between rich and poor households.

There is perhaps no issue in America more contentious than income inequality. Everybody has a theory as to why the gap between rich and poor has widened and what should be done — if anything — to close it. A full explanation should help us understand why the United States stands out for having an especially high and rising inequality of income.

There are three main factors at play: technology, trade, and politics. Technological innovations have raised the demand for highly trained workers, thereby pushing up the incomes of college-educated workers relative to high-school-educated workers. Global trade has exposed the wages of industrial workers to tough international competition from workers at much lower pay scales. And our federal politics has tended, during the past 35 years, to weaken the political role of the working class, diminish union bargaining power, and cap or cut the government benefits received by working-class families.

Consider technology. Throughout modern history, ingenious machines have been invented to replace heavy physical labor. This has been hugely beneficial: Most (though not all) American workers have been lucky to escape the hard toil, drudgery, dangers, and diseases of heavy farm work, mining, and heavy industry. Farm jobs have been lost, but with some exceptions, their backbreaking drudgery has been transformed into office jobs. Farm workers and miners combined now account for less than 1 percent of the labor force.

Yet the office jobs required more skills than the farm jobs that disappeared. The new office jobs needed a high school education, and, more recently, a college degree. So who benefited? Middle-class and upper-class kids fortunate enough to receive the education and skills for the new office jobs. And who lost? Mostly poorer kids who couldn’t afford the education to meet the rising demands for skilled work.

Now the race between education and technology has again heated up. The machines are getting smarter and better faster than ever before — indeed, faster than countless households can help their kids to stay in the job market. Sure, there are still good jobs available, as long as you’ve graduated with a degree in computer science from MIT, or at least a nod in that direction.

Globalization is closely related to technology and, indeed, is made possible by it. It has a similar effect, of squeezing incomes of lower-skilled workers. Not only are the assembly-line robots competing for American jobs; so too are the lower-waged workers half a world away from the United States. American workers in so-called “traded-goods” sectors, meaning the sectors in direct competition with imports, have therefore faced an additional whammy of intense downward pressure on wages.

For a long time, economists resisted the public’s concern about trade depressing wages of lower-skilled workers. Twenty-two years ago I coauthored a paper arguing that rising trade with China and other low-wage countries was squeezing the earnings of America’s lower-skilled workers. The paper was met with skepticism. A generation later, the economics profession has mostly come around to recognize that globalization is a culprit in the rise of income inequality. This doesn’t mean that global trade should be ended, since trade does indeed expand the overall economy. It does, however, suggest that open trade should be accompanied by policies to improve the lot of lower-wage, lower-skilled workers, especially those directly hit by global trade but also those indirectly affected.

Many analyses of rising income inequality stop at this point, emphasizing the twin roles of technology and trade, and perhaps debating their relative importance. Yet the third part of the story — the role of politics — is perhaps the most vital of all. Politics shows up in two ways. First, politics helps to determine the bargaining power of workers versus corporations: how the overall pie is divided between capital and labor. Second, politics determines whether the federal budget is used to spread the benefits of a rising economy to the workers and households left behind.

Unfortunately, US politics has tended to put the government’s muscle on behalf of big business and against the working class. Remember the Reagan revolution: tax cuts for the rich and the companies, and union-busting for the workers? Remember the Clinton program to “end welfare as we know it,” a program that pushed poor and working-class moms into long-distance commuting for desperately low wages, while their kids were often left back in dangerous and squalid conditions? Remember the case of the federal minimum wage, which has been kept so low for so long by Congress that its inflation-adjusted value peaked in 1968?

There is no deep mystery as to why federal politics has turned its back on the poor and working class. The political system has become “pay to play,” with federal election cycles now costing up to $10 billion, largely financed by the well-heeled class in the Hamptons and the C-suites of Wall Street and Big Oil, certainly not the little guy on unemployment benefits. As the insightful political scientist Martin Gilens has persuasively shown, when it comes to federal public policy, only the views of the rich actually have sway in Washington.

So in the end, the inequality of income in the United States is high and rising while in other countries facing the same technological and trade forces, the inequality remains lower, and the rise in inequality has tended to be less stark. What explains the difference in outcomes? In the other countries, democratic politics offers voice and representation to average voters rather than to the rich. Votes and voters matter more than dollars.

To delve more deeply into the comparison between the United States and other countries, it is useful to measure the inequality of income in each country in two different ways. The first way measures the inequality of “market incomes” of households, that is, the income of households measured before taxes and government benefits are taken into account. The second measures the inequality of “disposable income,” taking into account the taxes paid and transfers received by the household.

The difference between the two measures shows the extent of income redistribution achieved through government taxation and spending. In all of the high-income countries, the inequality of market income is greater than the inequality of disposable income. The taxes paid by the relatively rich and the transfers made to the relatively poor help to offset some of the inequality of the marketplace.

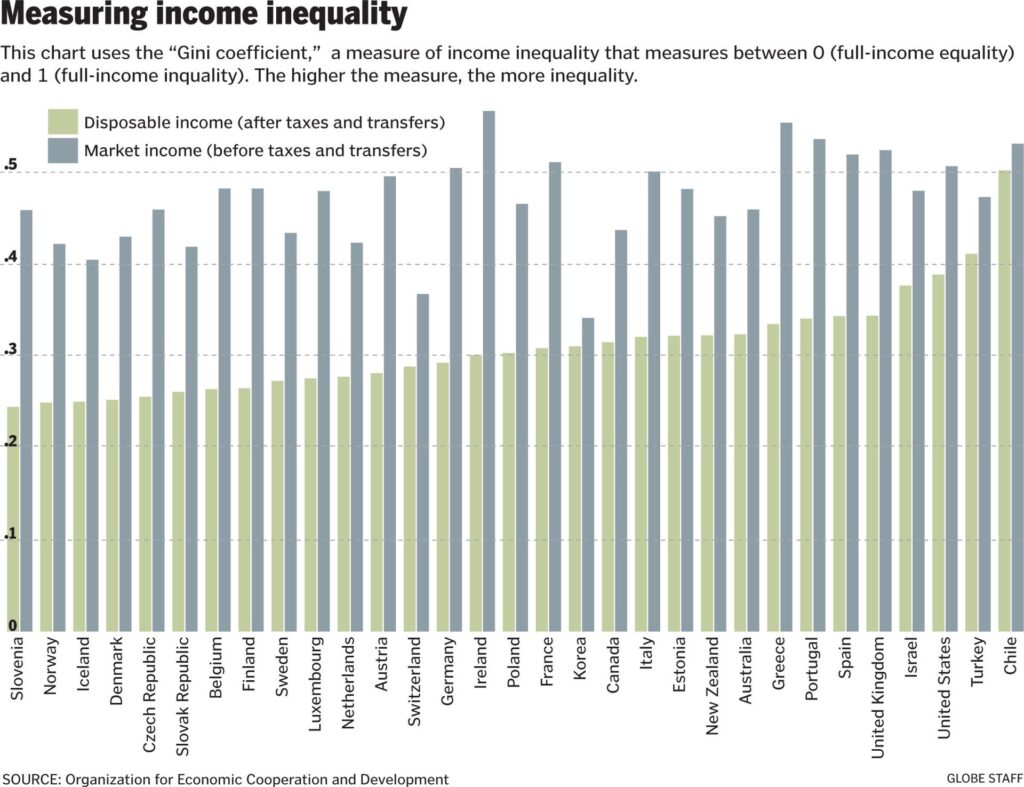
The accompanying chart offers just this comparison for the high-income countries. For each country, two measures of inequality based on the “Gini coefficient” are calculated. The Gini coefficient is a measure of income inequality that varies between 0 (full-income equality across households) and 1 (full-income inequality, in which one household has all of the income). Countries as a whole tend to have a Gini coefficient of disposable income somewhere between 0.25 (low inequality) and 0.60 (very high inequality).

In the figure, we see the two values of the Gini coefficient for each country: a higher value (more inequality) based on market income and a lower value (less inequality) based on disposable income (that is, after taxes and transfers). We can see that in every country, the tax-and-transfer system shifts at least some income from the rich to the poor, thereby pushing down the Gini coefficient. Yet the amount of net redistribution is very different in different countries, and is especially low in the United States.

Compare, for example, the United States and Denmark. In the United States, the Gini coefficient on market income is a very high 0.51, and on disposable income, 0.40, still quite high. In Denmark, by comparison, the Gini coefficient on market income is a bit lower than the United States, at 0.43. Yet Denmark’s Gini coefficient on disposable income is far lower, only 0.25. America’s tax-and-transfer system reduces the Gini coefficient by only 0.11. Denmark’s tax-and-transfer system reduces the Gini coefficient by 0.18, half-again as high as in the United States.

How does Denmark end up with so much lower inequality of disposable income from its budget policies? Denmark taxes more heavily than the United States and uses the greater tax revenue to provide free health care, child care, sick leave, maternity and paternity leave, guaranteed vacations, free university tuition, early childhood programs, and much more. Denmark taxes a hefty 51 percent of national income and provides a robust range of high-quality public services. The United States taxes a far lower 31 percent and offers a rickety social safety net. In the United States, people are left to sink or swim. Many sink.

So, many Americans would suspect, Denmark is miserable and being crushed by taxes, right? Well, not so right. Denmark actually comes out number 1 in the world happiness rankings, while the United States comes in 13th. Denmark’s life expectancy is also higher, its poverty lower, and its citizens’ trust in government and in each other vastly higher than the equivalent trust in the United States.

So herin lies a key lesson for the United States. America’s inequality of disposable income is the highest among the rich countries. America is paying a heavy price in lost well-being for its high and rising inequality of income, and for its failure to shift more benefits to the poor and working class.

We have become a country of huge distrust of government and of each other; we have become a country with a huge underclass of people who can’t afford their prescription drugs, tuition payments, or rents or mortgage payments. Despite a roughly threefold increase in national income per person over the past 50 years, Americans report to survey takers no higher level of happiness than they did back in 1960. The fraying of America’s social ties, the increased loneliness and distrust, eats away at the American dream and the American spirit. It’s even contributing to a rise in the death rates among middle-aged, white, non-Hispanic Americans, a shocking recent reversal of very long-term trends of rising longevity.

The current trends will tend to get even worse unless and until American politics changes direction. As I will describe in a later column, the coming generation of yet smarter machines and robots will claim additional jobs among the lower-skilled workers and those performing rote activities. Wages will be pushed lower except for those with higher training and skills. Capital owners (who will own the robots and the software systems to operate them) will reap large profits while many young people will be unable to find gainful employment. The advance in technology could thereby contribute to a further downward spiral in social cohesion.

That is, unless we decide to do things differently. Twenty-eight countries in the Organization for Economic Cooperation and Development have lower inequality of disposable income than the United States, even though these countries share the same technologies and compete in the same global marketplace as the United States. These income comparisons underscore that America’s high inequality is a choice, not an irreversible law of the modern world economy.


Are Trade Deals Good For America?

Both Bernie Sanders and Donald Trump are blaming free-trade deals for the decline of working-class jobs and incomes. Are they right?

Clearly, America has lost a significant number of factory jobs over the last three decades. In 1980, 1 in 5 Americans worked in manufacturing. Now it’s 1 in 12.

Today Ohio has a third fewer manufacturing jobs than it had in 2000. Michigan is down 32 percent.

Trade isn’t the only culprit. Technological change has also played a part.

When I visit one of America’s remaining factories, I rarely see assembly-line workers. I don’t see many workers at all. Instead, I find a handful of technicians sitting behind computer screens. They’re linked to fleets of robots and computerized machine tools who do the physical work.

There’s a lively debate among researchers as to whether trade or technology is more responsible for the decline in factory jobs. In reality the two can’t be separated.

Were it not for technological breakthroughs we wouldn’t have the huge cargo containers, massive container ports and cranes, and satellite and Internet communications systems that have created highly-efficiently worldwide manufacturing systems.

These systems have relocated factory jobs from the United States to Asia, especially to China. Researchers find the biggest losses in American manufacturing started in 2001 when China joined the World Trade Organization, requiring the U.S. to lower tariffs on Chinese goods.

MIT economist David Autor and two co-authors estimate that between 2000 and 2007 the United States lost close to a million manufacturing jobs to China – about a quarter of the total decline in those years. Robert Scott of the Economic Policy Institute puts the loss since then at about 3 million.

This doesn’t mean free trade has been entirely bad for Americans. It’s given us access to cheaper goods, saving the typical American thousands of dollars a year.

A recent study by economists at UCLA and Columbia University found that trade has increased the real incomes of the U.S. middle class by 29 percent, and even more for those with lower incomes.

But trade has widened inequality and imposed a particular burden on America’s blue-collar workers.

If you’re well educated, free trade has given you better access worldwide markets for your skills and insights – resulting directly or indirectly in higher pay.

On the other hand, if you’re not well educated, the trade deals of the last quarter century have very likely taken away the factory job you (or your parents or grandparents) once relied on for steady work with good pay and generous benefits.

These jobs were the backbone of the old American middle class. Now they’re almost all gone, replaced by lower-paying service jobs in places like retail stores, restaurants, hotels, and hospitals.

The change has been a dramatic. A half century ago America’s largest private-sector employer was General Motors, whose full-time workers earned an average hourly income (including health and pension benefits) of around $50, in today’s dollars.

Today America’s largest employer is Walmart, whose typical employee earns just over $9 an hour. A third of Walmart’s employees work less than 28 hours per week and don’t even qualify for benefits.

The core problem isn’t really free trade, or even the loss of factory jobs per se. It’s the demise of an entire economic system in which people with only high-school degrees, or less, could count on good and secure jobs.

That old system included strong unions, CEOs with responsibilities to their employees and communities and not just to shareholders, and a financial sector that didn’t demand the highest possible returns every quarter.

Trade has contributed to the loss of this old system, but that doesn’t necessarily mean we should give up on free trade. We should create a new system, in which a greater share of Americans can be winners.

But will we? The underlying political question is whether the winners from America’s current economic system – people with college degrees, the right connections, and good jobs that put them on the winning side of the divide – will support new rules that widen the circle of prosperity to include those who have been on the losing side.

Those new rules might include, for example, a much larger Earned Income Tax Credit (effectively, a wage subsidy for lower-income workers), stronger unions in the service sector, world-class education for all (including free public higher education), a single-payer healthcare plan, more generous Social Security, and higher taxes on the wealthy to pay for all this.

If the winners refuse to budge, America could turn its back on free trade – and much else. Indeed, there’s no telling where the anger we’ve seen this primary might lead.

What Happens When The Government Tightens Its Belt? (Part II)

In a recent post (What Happens When the Government Tightens Its Belt?), I used a simple teeter-totter diagram to show how the government’s financial balance is related to the private sector’s financial balance in a closed economy. With only two sectors – government and non-government – I showed that a government deficit necessarily implies a surplus in the private sector.


As expected, this accounting truism ruffled the feathers of a flock of readers who have been programmed to launch into an anti-government tirade at the mere mention of the public sector and to regard the dangers of deficit spending as an unimpeachable fact. And while you’re certainly entitled to your own political views, you are not, as Senator Moynihan famously said, entitled to your own facts.

Other, less impenetrable minds, agreed that the private sector’s financial position must improve as the government’s deficit increases in a closed economy, but they argued that I had not demonstrated anything meaningful because I ignored the financial flows that occur in an open economy.

I still hope to convince both groups that they are acting against their own economic interests when they support policies to balance the budget or reduce the deficit, either by raising taxes or cutting government expenditures. So let’s continue the exercise and, as promised, extend the argument to the more realistic open-economy in which we actually live.

In an open economy, income flows into and out of the domestic economy as residents and foreigners buy goods and services (exports minus imports), make and receive payments such as interest and dividends (factor income) and make net transfer payments (such as foreign aid). Each country keeps track of these payments using a balance of payments (BOP) account, which summarizes the international monetary transactions that take place between the home country and the rest of the world. The BOP has two primary components – the current account and the capital account – and we can use either one to show whether, on balance, money is flowing into or out of a country.

When we incorporate these international flows, we transform the closed-economy accounting identity I used in my previous post:

[1] Domestic Private Surplus = Government Deficit

into the open-economy accounting identity shown below:

[2] Domestic Private  = Government + Current Account

Surplus      Deficit      Balance

or, equivalently,

[3] Domestic Private = Government + Capital Account

Surplus      Surplus      Balance

When the current account balance is positive, it means that we in the private sector (households and domestic firms) are accumulating net financial claims on foreigners. When it is negative, they are accumulating net financial claims on us. Thus, a positive current account implies a negative capital account and vice versa.

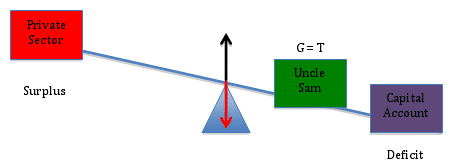
To see this in the context of the teeter-totter model, let’s initially hold the public sector’s balance constant at zero (i.e. let’s assume the government is balancing its budget so that G = T). With the government budget in balance, Uncle Sam is a “weightless” entity on the teeter-totter, so that the private sector’s financial position will simply reflect the “weight” of the capital account. Suppose, first, that the current account is in surplus (i.e. the capital account shows an equivalent deficit):


The image above depicts the benefit (to the private sector) of a current account surplus (a.k.a a capital account deficit), and it is the outcome that many of you accused me of sidestepping in my previous post. Of course, the U.S. does not have a current account surplus, so let’s address that point before moving on. (And lest anyone begin to hyperventilate, I’ll also address the fact that G ≠ T). First, the current account.

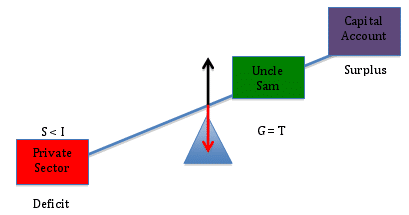
Sticking with (G = T) for the moment, we can show how a current account deficit impacts the private sector’s financial position. As the capital account moves from deficit (diagram above) into surplus (diagram below), we see that the private sector’s financial position moves from surplus into deficit.


But does this all of this hold true in the real world, or is it some kind of economic chicanery? Let’s check the facts.

Equations [2] and [3] above are not based on economic theory. They are accounting identities that always “add up” in the real world. So let’s firm up the discussion about the implications of government “belt tightening” by running through some examples using the real world data found in the table below (Hat tip to Scott Fullwilir for sharing the file. All of the data comes from the National Income and Product Accounts (NIPA) and the Flow of Funds.)

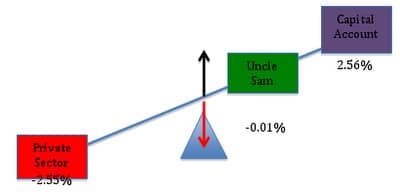
Let’s begin with the data from 1998 (Q3), when the public sector deficit was just 0.01% of GDP and the current account deficit was 2.56% of GDP. Plugging these numbers into equation [2] above, the identity tells us (and the data in the table confirm) that the private sector’s balance must have been:

[2] Domestic Private Sector’s Balance = 0.01% + (-2.56% )= -2.55%


Here, we can see that the private sector’s financial position was deteriorating because it was making large (net) payments to foreigners. Because this loss of financial resources was not offset by the public sector, the private sector’s financial position deteriorated.

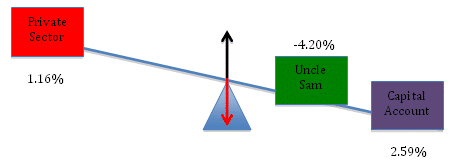
To see how a bigger government deficit would have improved the private sector’s financial position, let’s look at the data from 1988 (Q1). As a percent of GDP, the current account balance was 2.59%, nearly the same as before, while the government’s deficit came in at a much higher 4.2% of GDP. We can use Equation [2] to see effect of the larger budget deficit:

[2] Domestic Private Sector’s Balance = 4.2% + (-2.59%) = 1.61%

In this period, the private sector ends up with a surplus because the government’s deficit was large enough to more than offset the negative effect of the current account deficit.


Again, this is simply a property of the sectoral balance sheet identities. Whenever the government’s deficit is too small to offset a deficit in the current account, the private sector will experience a net loss. The result my ruffle your feathers, but it is an unimpeachable fact.

So let’s go back to President Obama’s comment and the reason I wrote this blog in the first place. The President said:

“Small businesses and families are tightening their belts. Their government should, too.”

Wrong! When we tighten our belts, it means that we are trying to build up our savings. We do this by spending less. But spending drives our economy. Sales create jobs. So unless Obama has a secret plan to reverse three decades of current account deficits, the Government needs to loosen its belt when we tighten ours. If it doesn’t, then millions of us will lose our shirts.

*An aside: I am aware that I have said nothing about the usefulness of the spending projects, the waste and inefficiency that exists with many government programs, cronyism, inequality, etc., etc. These are legitimate and important questions, but they are not the focus of this analysis. I wrote this series of blogs to try to get people to understand the interplay between the private, public and foreign sectors’ balance sheets.

What Happens When The Government Tightens Its Belt?

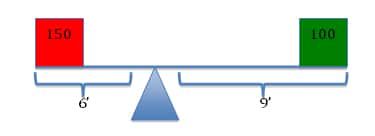
Imagine two people sitting on opposite ends of a 15-foot teeter-totter. The laws of physics dictate that the seesaw will balance if the product of the first mass (w1) and its distance (d1) from the fulcrum (i.e. the balancing point) is equal to the product of the other mass (w2) and its distance (d2) from the fulcrum.

Thus, the physicist can show that the teeter-totter will be in balance when the fulcrum is placed 6 feet from the end holding a 150lb person and 9 feet from the end holding a 100lb person. Moreover, the laws of physics ensure that an imbalance will arise if the mass or the relative position of one of the people is changed.


The laws of accounting allow us to demonstrate that similarly powerful concepts apply to the science of economics. Beginning with the simple identity for GDP in a closed economy, we have:

[1] Y = C + I + G, where:

Y = GDP = National Income
C = Aggregate Consumption Expenditure
I = Aggregate Investment Expenditure
G = Aggregate Government Expenditure

For economists, this is as obvious as stating that a linear foot is the sum of 12 sequential inches. It simply recognizes that the total amount of money spent buying newly produced goods and services will yield an equivalent income to the sellers of these products. Thus, it demonstrates that expenditures are a source of income.

Once earned, income can be allocated in one of three ways. At the end of the day, all income (Y) will be spent (C), saved (S) or used in payment of taxes (T):

[2] Y = C + S + T

Since they are equivalent expressions for Y, we can set equation [1] equal to equation [2], giving us:

C + I + G = C + S + T

Or, after canceling (C) from both sides and moving terms around:

[3] (S – I) = (G – T)

Equation [3] shows that there is a direct relationship between what’s happening in the private sector (S – I) and what’s happening in the public sector (G – T). But it is not the one that Pete Peterson, Erskin Bowles, or President Obama would have you believe. And I want you to understand why they are wrong.

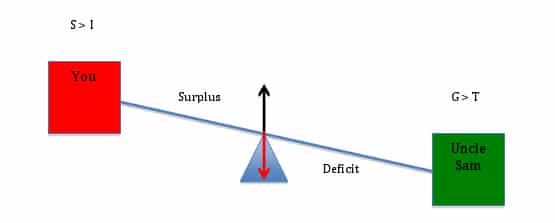
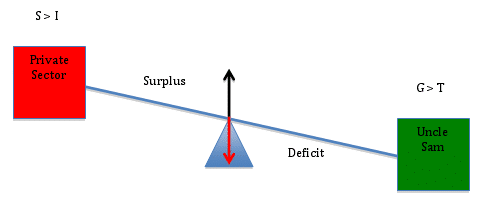
To understand the argument, imagine that you and Uncle Sam are sitting on opposite ends of a teeter-totter. You represent the private sector, and your financial status is given by (S – I). Your budget can be in balance (S = I), in deficit (S < I) or in surplus (S > I). When your financial status is positive (S > I), you are net saving. When your financial status is negative (S < I), you are net borrowing. Uncle Sam’s financial status is equal to (G – T), and, like yours, his budget may be balanced (G = T), in deficit (G > T) or in surplus (G < T). When you interact, only three outcomes are possible.

First, it is conceivable that (S = I) and (G = T) so that (S – I) = 0 and (G – T) = 0. When this condition holds, the teeter-totter will level off with each of you experiencing a balanced budget.


In the above scenario, the government is balancing its receipts (T) and expenditures (G), and you are balancing your savings and investment spending. There is no net gain/loss.

But suppose the government begins to spend more than it collects in taxes (i.e. G > T). How will Uncle Sam’s deficit affect your position on the teeter-totter? The answer is as straightforward as increasing the mass of the person on the right-hand side of the seesaw. As Uncle Sam’s financial position turns negative, your financial position turns positive.


This should make intuitive as well as mathematical sense, because when Uncle Sam runs a deficit, you receive more financial assets than you lose through taxation. Put simply, Uncle Sam’s deficit lifts you into a surplus position. Moreover, bigger deficits mean bigger surpluses for you.

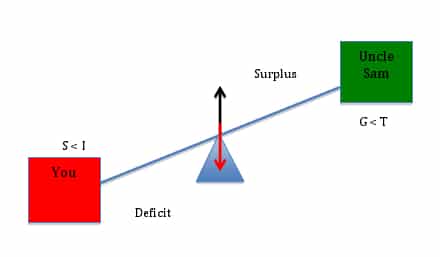
Finally, let’s see what happens when Uncle Sam tightens his belt. Suppose, for example, that we were able to duplicate the much-coveted surpluses of 1999-2001. What would (and did!) happen to the private sector’s financial position?


Because the economy’s financial flows are a closed system – every payment must come from somewhere and end up somewhere – one sector’s surplus is always the other sector’s deficit. As the government “tightens” its belt, it “lightens” its load on the teeter-totter, shifting the relative burden onto you.

This is not rocket science, but it appears to befuddle scores of educated people, including President Obama, who said, “small businesses and families are tightening their belts. Their government should, too.” This kind of rhetoric may temporarily boost his approval ratings, but the policy itself will undermine the efforts of the very families and small businesses that are trying to improve their financial positions.